GCP – New ways to manage custom Cloud Monitoring dashboards
Earlier this year, we added a Dashboard API to Cloud Monitoring, allowing you to manage custom dashboards and charts programmatically, in addition to managing them with the Google Cloud Console. Since then, you’ve asked us to provide more sample dashboard templates that target specific Google Cloud services. Many of you have also asked us to provide a Terraform module to help you set up an automated deployment process.
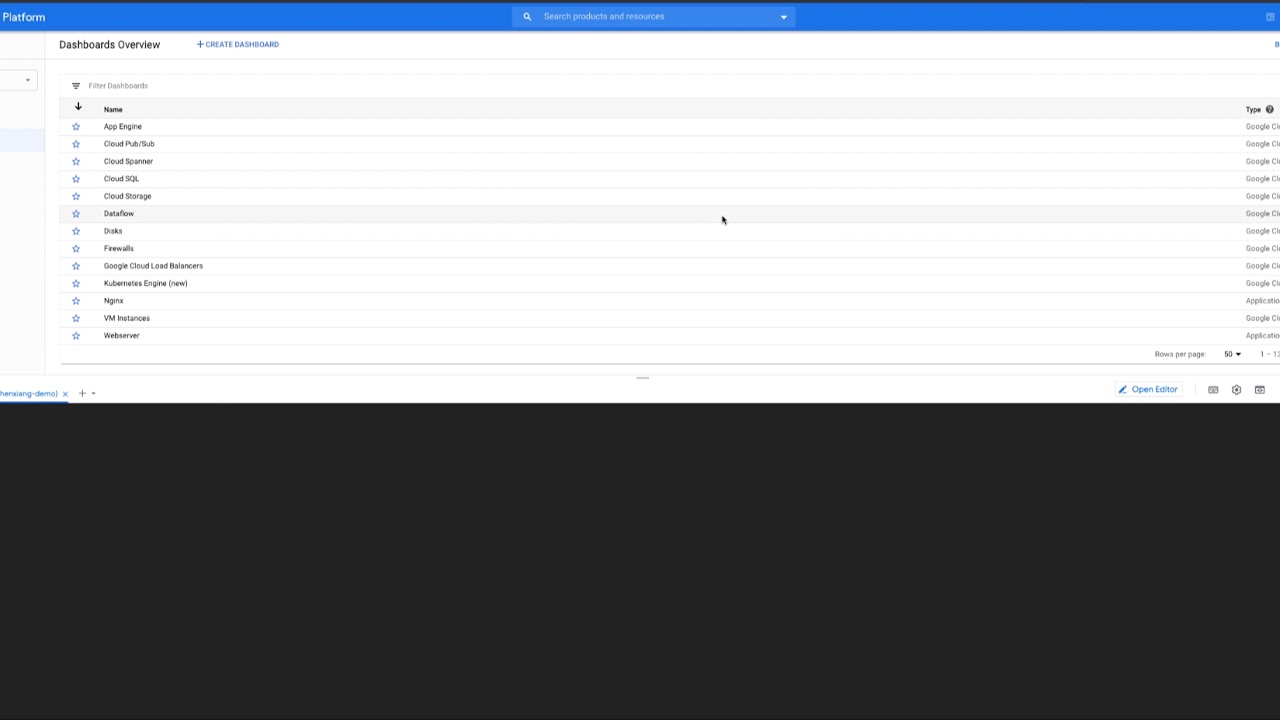
Today, we are excited to share our newly created GitHub repository with more than 30 dashboard templates to help you get started. These templates currently cover compute, storage, data processing, networking, database, tooling, and our microservice demo application. The Terraform module for this API is available on GitHub as well.
Using the sample dashboards
To help you understand the intent of each dashboard sample, there is a README file in each folder that summarizes the content and metrics used.
Please note that while putting these sample dashboards together, we made assumptions and aggregated some of the data based on specific use cases. For example, for CPU utilization and memory usage, the dashboard is by default unaggregated. For network egress and ingress, the widgets on the dashboard are aggregated by sum to reflect the intent to capture total bytes. In addition, a single dashboard can have multiple charts for different services. It allows you to quickly have a holistic view for the state of your workloads by grouping related services.For instance, the dataprocessing-monitoring.json template creates a dashboard that provides a view for the data processing pipeline metrics from multiple data analytics services.
To use these dashboard templates, you can check them out from the GitHub repo, use the gcloud CLI, Terraform, or Deployment Manager to deploy the samples to your project using the following steps:
1. Check it out from GitHub. You can do that in Cloud Shell by clicking on this button:

2. Use the gcloud monitoring dashboards create command to create a dashboard. Make sure you replace the [file-name.json] with the path in the command:
gcloud monitoring dashboards create --config-from-file=[file_name.json]
For example:
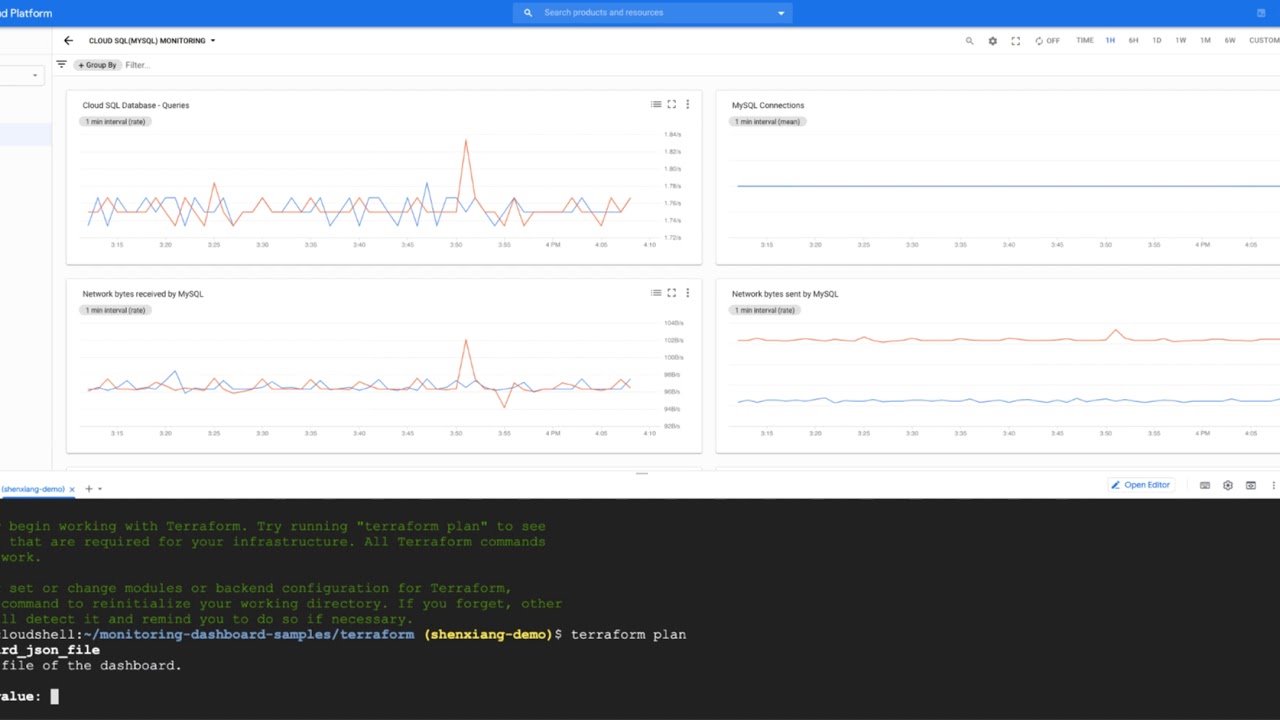
3. You can also use Terraform to deploy the dashboards. There is a script under the terraform folder that uses the dashboard module to demonstrate this step.
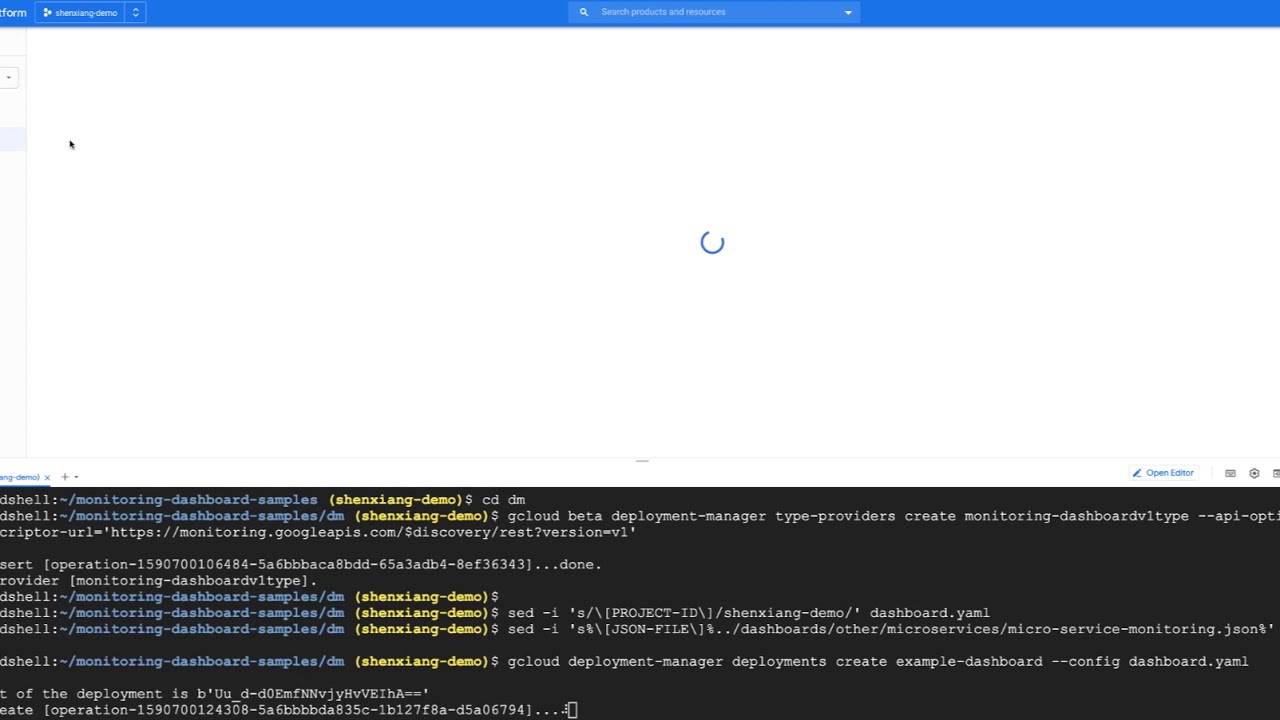
4. Alternatively, you can use Cloud Deployment Manager to deploy the dashboards using the scripts under the dm folder.
With these capabilities, it’s easier to integrate dashboard development and deployment into an automated pipeline. For instance, you can check your dashboard JSON files into a Git repository, and updates to the repository can trigger a Cloud Build process and automatically deploy the changes to Cloud Monitoring.
Over time, we hope to improve this template library, and here are a few things we are focusing on:
-
Covering more Google Cloud services
-
Extending our dashboard templates to cover multiple services under one dashboard
-
Providing built-in filters and aggregation capabilities to help you slice and dice your data so that you can have more insight
Please let us know if you have comments or feedback by creating issues in the repo. We welcome and encourage you to contribute and improve the new templates with us!
Read More for the details.
