GCP – How to enable Secure Boot for your AI workloads
As organizations race to deploy powerful GPU-accelerated workloads, they might overlook a foundational step: ensuring the integrity of the system from the very moment it turns on.
Threat actors, however, have not overlooked this. They increasingly target the boot process with sophisticated malware like bootkits, which seize control before any traditional security software can load and grant them the highest level of privilege to steal data or corrupt your most valuable AI models.
Why it matters: The most foundational security measure for any server is verifying its integrity the moment it powers on. This process, known as Secure Boot, is designed to stop deep-level malware that can hijack a system before its primary defenses are even awake.
Secure Boot is part of Google Cloud’s Shielded VM offering, which allows you to verify the integrity of your Compute VM instances, including the VMs that handle your AI workloads. It’s the only major cloud offering of its kind that can track changes beyond initial boot out of the box and without requiring the use of separate tools or event-driven rules.
The bottom line: Organizations don’t have to sacrifice security for performance. There is a clear, repeatable process to sign your own GPU drivers, allowing you to lock down your infrastructure’s foundation without compromising your AI workloads.
Our Secure Boot capability can be opted into at no additional charge, and now there’s a new, easier way to set it up for your GPU-accelerated machines.
- aside_block
- <ListValue: [StructValue([(‘title’, ‘$300 in free credit to try Google Cloud security products’), (‘body’, <wagtail.rich_text.RichText object at 0x3e333e1f3430>), (‘btn_text’, ‘Start building for free’), (‘href’, ‘http://console.cloud.google.com/freetrial?redirectPath=/welcome’), (‘image’, None)])]>
Understanding the danger of bootkits
It’s important to secure your systems from boot-level threats. Bootkits target the boot process, the foundation of an operating system. By compromising the bootloader and other early-stage system components, a bootkit can gain kernel-level control before the operating system and its security measures load. Malware can then operate with the highest privileges, bypassing traditional security software.
This technique falls under the Persistence and Defense Evasion tactics in the MITRE ATT&CK framework. Bootkits are difficult to detect and remove due to their low-level operation. They hide by intercepting system calls and manipulating data, persisting across reboots, stealing data, installing malware, and disabling security features.
Bootkits and rootkits pose a persistent, embedded threat, and have been observed as part of current threat actor trends from Google Threat Intelligence Group, the European Union Agency for Cybersecurity (ENISA), and the U.S. Cybersecurity and Infrastructure Security Agency (CISA). Google Cloud always works on improving the security of our solutions by strengthening our products and providing tools you can use yourself. In this article, we would like to demonstrate a new, easier way of setting up Secure Boot for your GPU-accelerated machines.
Limitations of Secure Boot with GPUs
Shielded VMs employ a TPM 2.0-compliant virtual Trusted Platform Module (vTPM) as their root of trust, protected by Google Cloud’s virtualization and isolation powered by Titan chips. While Secure Boot enforces signed software execution, Measured Boot logs boot component measurements to the vTPM for remote attestation and integrity verification.
Limitations start when you want to use a kernel module that is not part of the official distribution of your operating system. That is especially problematic for AI workloads, which rely on GPUs whose drivers are usually not part of official distributions. If you want to manually install GPU drivers on a system with Secure Boot, the system will refuse to use them because they won’t be properly signed.
How to use Secure Boot on GPU-accelerated machines
There are two ways you can tell Google Cloud to trust your signature when it confirms the GPU driver validity with Secure Boot: with an automated script, or manually.
The script that can help you prepare a Secure Boot compatible image is open-source and is available in our GitHub repository. Here’s how you can use it:
- code_block
- <ListValue: [StructValue([(‘code’, ‘# Download the newest version of the script:rncurl -L https://storage.googleapis.com/compute-gpu-installation-us/installer/latest/cuda_installer.pyz –output cuda_installer.pyzrnrn# Make sure you are logged in with gcloudrngcloud auth loginrnrn# Check available option for the build processrnpython3 cuda_installer.pyz build_image –helprnrn# Use the script to build an image based on Ubuntu 24.04rnPROJECT = your_project_namernZONE = zone_you_want_to_usernSECURE_BOOT_IMAGE = name_of_the_final_imagernrnpython3 cuda_installer.pyz build_image –project $PROJECT –vm-zone $ZONE –base-image ubuntu-24 $SECURE_BOOT_IMAGE’), (‘language’, ”), (‘caption’, <wagtail.rich_text.RichText object at 0x3e333e1f30a0>)])]>
The script will execute each of the five steps described below for you. It may take up to 30 minutes, as the installation process takes this much time. We’ve also detailed how to use the building script in our documentation.
To manually tell Google Cloud to trust your signature, follow these five steps (also available in our documentation):
-
Generate your own certificate to be used for signing the driver.
-
Create a fresh VM with the OS of your choice (Secure Boot disabled, GPU not required).
-
Install and sign the GPU driver (and optionally CUDA toolkit).
-
Create a new Disk Image based on the machine with a self-signed driver, adding your certificate to the list of trusted certificates.
-
The new image can be now used with Secure Boot enabled VMs.
Whether you used the script or performed the task manually, you’ll want to verify that the process worked.
Start a new GPU accelerated VM using the created image
To verify that everything worked, we can create a new VM using the new disk image with the following command (we enable the Secure Boot option to verify that our process worked).
- code_block
- <ListValue: [StructValue([(‘code’, ‘# Create a new VM with T4 GPU to verify that everything works. Note that here ZONE needs to have T4 GPUs available.rnTEST_INSTANCE_NAME = name_of_the_test_instancernrngcloud compute instances create $TEST_INSTANCE_NAME \rn–project=$PROJECT \rn–zone=$ZONE \rn–machine-type=n1-standard-4 \rn–accelerator=count=1,type=nvidia-tesla-t4 \rn–create-disk=auto-delete=yes,boot=yes,device-name=$TEST_INSTANCE_NAME,image=projects/$PROJECT/global/images/$SECURE_BOOT_IMAGE,mode=rw,size=100,type=pd-balanced \rn–shielded-secure-boot \rn–shielded-vtpm \rn–shielded-integrity-monitoring \rn–maintenance-policy=TERMINATErnrn# gcloud compute ssh to run nvidia-smi and see the outputrngcloud compute ssh –project=$PROJECT –zone=$ZONE $TEST_INSTANCE_NAME –command “nvidia-smi”rnrn# If you decided to also install CUDA, you can verify it with the following commandrngcloud compute ssh –project=$PROJECT –zone=$ZONE $TEST_INSTANCE_NAME –command “python3 cuda_installer.pyz verify_cuda”‘), (‘language’, ”), (‘caption’, <wagtail.rich_text.RichText object at 0x3e3338282af0>)])]>
Clean up
When you verify that the new image works, there’s no need to keep the verification VM around. You can delete it with:
- code_block
- <ListValue: [StructValue([(‘code’, ‘gcloud compute instances delete –zone=$ZONE –project=$PROJECT $TEST_INSTANCE_NAME’), (‘language’, ”), (‘caption’, <wagtail.rich_text.RichText object at 0x3e3338282130>)])]>
Enabling Secure Boot
Now that you have built a Secure Boot compatible base image for your GPU-based workloads, remember to actually enable Secure Boot on your VM instances when you use those images! Secure Boot is disabled by default, so it needs to be explicitly enabled for Compute Engine instances.
When creating new instances
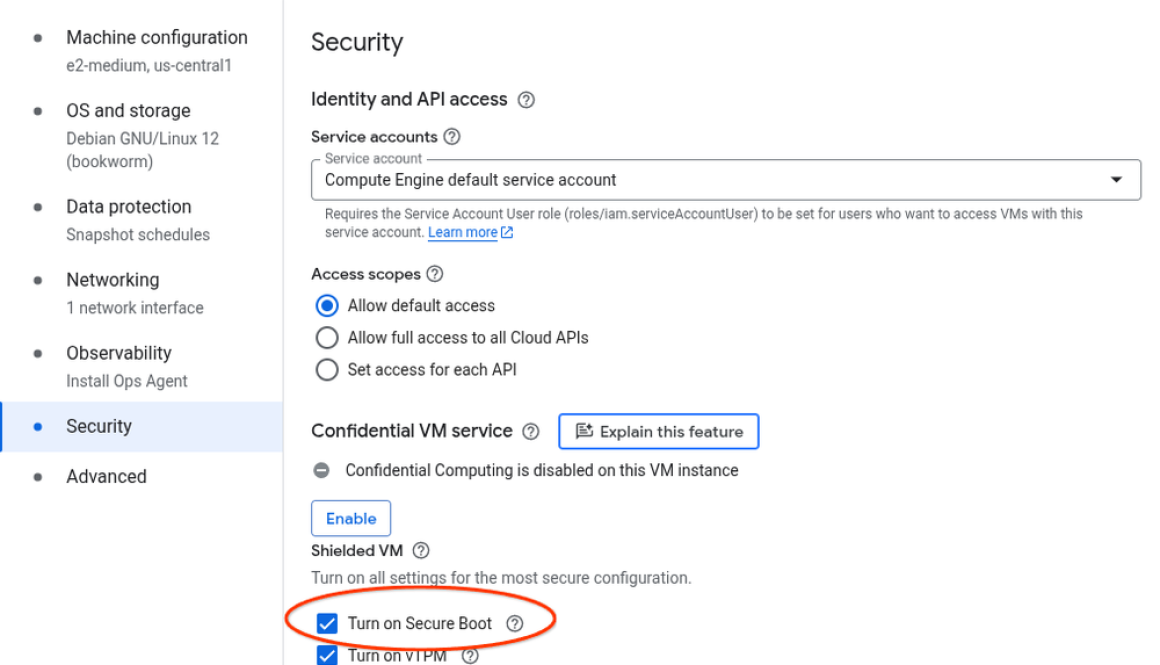
If you create a new instance using Cloud Console, the checkbox to enable Secure Boot can be found in the Security tab of the creation page, under the Shielded VM section.

For the gcloud enthusiasts, there’s –shielded-secure-boot flag available for the gcloud compute instances create command.
Updating existing instances
You can also enable Secure Boot for instances that already exist, however, make sure that they are running a compatible system. If the driver installed on those machines is not signed with a properly configured key, the driver will not be loaded. To update Secure Boot configuration for existing VMs, you’ll have to follow the stop, update and restart procedure, as described in this documentation page.
Get started
Make sure to visit our documentation page to learn more about the process and follow our GitHub repository to stay up to date with other GPU automation news.
Read More for the details.

