GCP – Three ways tight integration makes logging and monitoring easier
Driving productivity of software development and delivery teams is critical for any organization. The six years of research by DevOps Research and Assessment (DORA) showcases the role easy-to-use tooling plays in driving this productivity and in turn a better work/life balance for the team. The research finds that highest performing teams are 1.5x more likely to have tools they consider easy to use. A critical aspect of usability is how well the software development and delivery tools, including those used for monitoring and logging, integrate with each other.
Google Cloud is making it seamless for teams to get complete visibility via deep integration of observability tools with our compute platforms, including Google Kubernetes Engine (GKE), Google Compute Engine (GCE), and serverless platforms such as Cloud Run.
Let’s look into three ways that deep integration makes monitoring and troubleshooting easier in Google Cloud:
1. View, analyze, and query logs from all services, in one location with zero configuration
Last year Google Cloud brought Stackdriver into the Google Cloud Console under an Operations header with straightforward service names such as Logging and Monitoring. Clicking on Logging from the left navigation pane will bring up the Logs Explorer. Logs Explorer gives you an aggregated view of your logs across your projects with a query tool, a filter, a histogram, and list of queried or filtered logs. There is no need to set up a separate project to access your logs. Logs are streamed, real time into Logs Explorer.
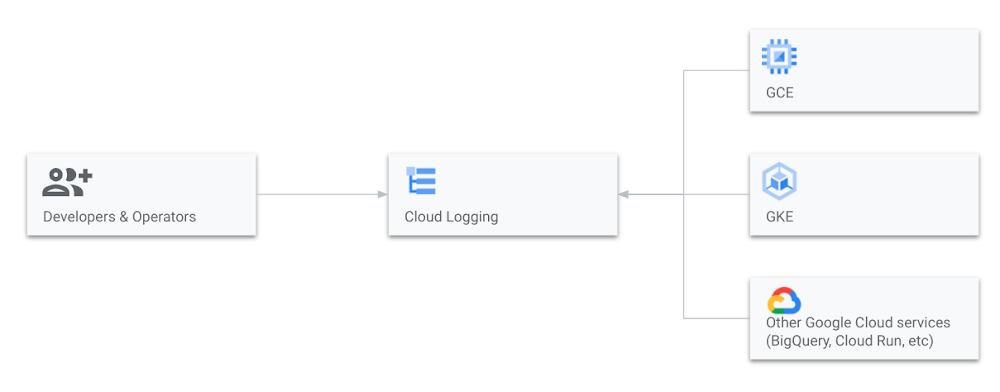
If you do not regularly work in the Google console, you can retrieve log entries from Logging and display them in your IDE by using the gcloud command, via Cloud Code, or using the API Explorer. Currently in preview, Live tailing lets you view your log entries in real time as Cloud Logging writes them using the gcloud tool or using the API Explorer as well.
2. Logs, metrics and traces at a glance and available in context
The data that you track, analyze and visualize is most useful when it is providing actionable insights and taking action is easier when your resources are just a click away. When you detect an anomaly in a dashboard or when an alert is fired, there is no need to log into another portal or console to start troubleshooting and remediating. You have access to observability data in-context with deep links to logging and monitoring services for that resource.
And we’ve applied years of operating at scale to build default views of data to surface what is important. The GKE Dashboard in Cloud Monitoring displays a fleet-wide view of your deployments at the cluster, namespaces, nodes, workloads, pods, and containers levels. From any of these resources you can click into the logs, metrics and incidents. This fleet-view of resources is also available for your VMs in the GCE Dashboard.
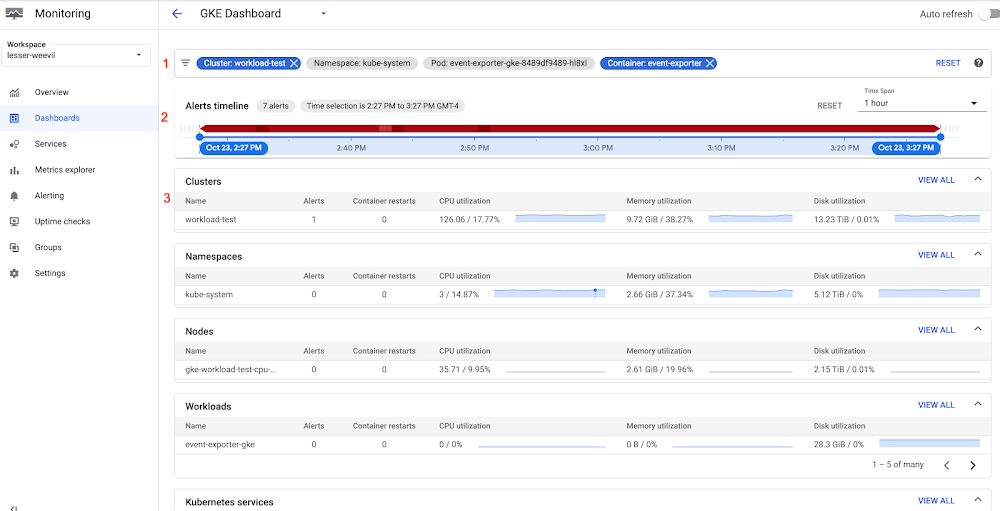
3. GKE clusters and GCE VMs metrics and logs are available out of the box
When you deploy a new cluster on GKE, agents to collect system and workload logs and metrics are installed and configured automatically. Metrics and logs will automatically start flowing to Cloud Logging and Cloud Monitoring when you deploy your first workload.
Basic system metrics and logs are available by default on VMs. If you want deeper system and application-level metrics and logs, you will need to install agents. There are three easy ways to start the agent installation process:
1. If you have many VMs that you are managing, you can create an Agent Policy that governs new and existing VMs, ensuring proper installation and optional auto-upgrade of all agents.
2. If you have fewer VMs to manage, you find a list of all the VMs in your project and the status of their logging and monitoring agents in the VM Inventory dashboard in Cloud Monitoring. You can install the agents right from this dashboard.
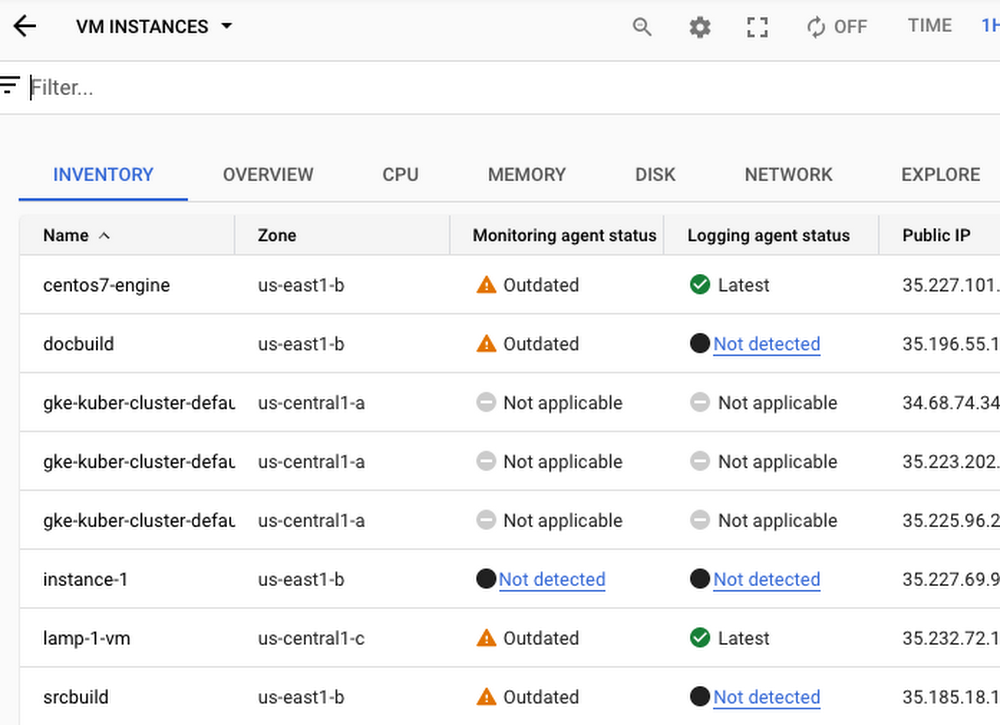
The VM Inventory dashboard displays all of your VMs in Google Cloud and the status of their agents.
3. Other options: You can install the agents on a single VM or a fleet of VMs using the command-line or set up a language runtime.
Start observing today
Easy-to-use tooling is just one of the ways that elite development teams are deploying 200X more frequently, while having a 7X lower change failure rate compared to their low performing peers, according to DORA research. If you have an application running in Google Cloud visit the Logs Explorer or the Monitoring Overview pages in the Console to start exploring how deeply integrated tools can make your life in the cloud easier. To learn more about features, read customer success stories, and view pricing, visit the Cloud operations page.
Read More for the details.
