GCP – Taming the stragglers: Maximize AI training performance with automated straggler detection
Stragglers are an industry-wide issue for developers working with large-scale machine learning workloads. The larger and more powerful these systems become, the more their performance is hostage to the subtle misbehavior of a single component. Training the next-generation large-scale models requires a new class of supercomputer, built by interconnecting tens of thousands of powerful accelerators.
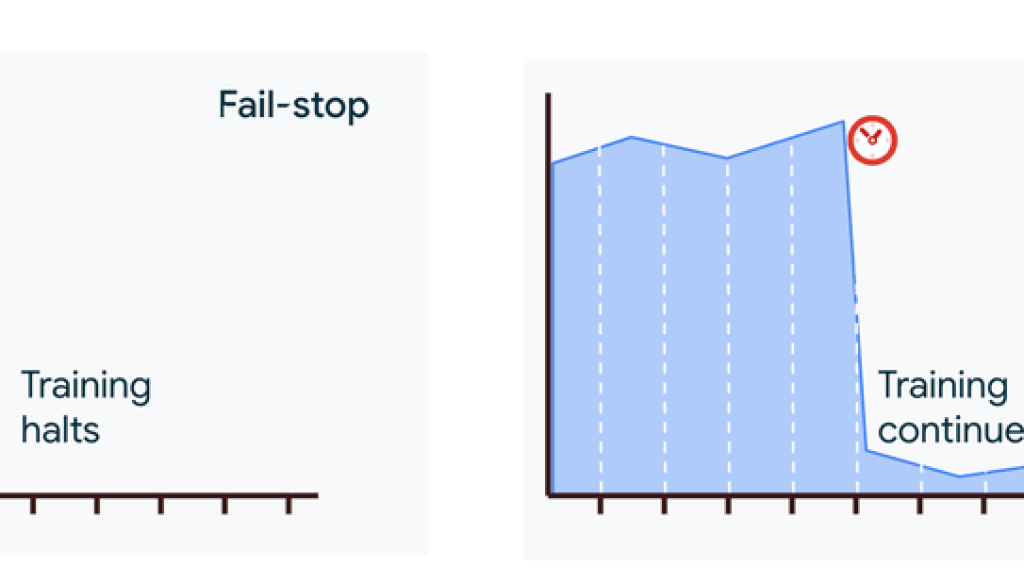
In these distributed systems, failures come in two flavors. The first, a fail-stop failure, is obvious—a component crashes and goes silent. The second is far more insidious: a fail-slow failure. Here, a component doesn’t stop working; it just gets slow. This underperforming node, or “straggler,” continues to participate in computations, but its sluggishness creates a drag on the entire system, turning a minor hardware or software issue into a significant bottleneck that drastically increases the overall training time.

Improving the reliability of these massive systems means focusing on two key metrics: increasing the Mean Time Between Interruptions (MTBI) and reducing the Mean Time To Recovery (MTTR). The recovery process itself can be broken down into four stages: first, detecting that a problem has occurred; second, localizing the fault to a specific component; third, recovering the workload by reconfiguring the system around the issue; and finally, performing offline root-cause analysis to prevent the problem from recurring.
In this post, we’ll explore where stragglers come from, and show you how to get started with automated straggler detection on Google Cloud.
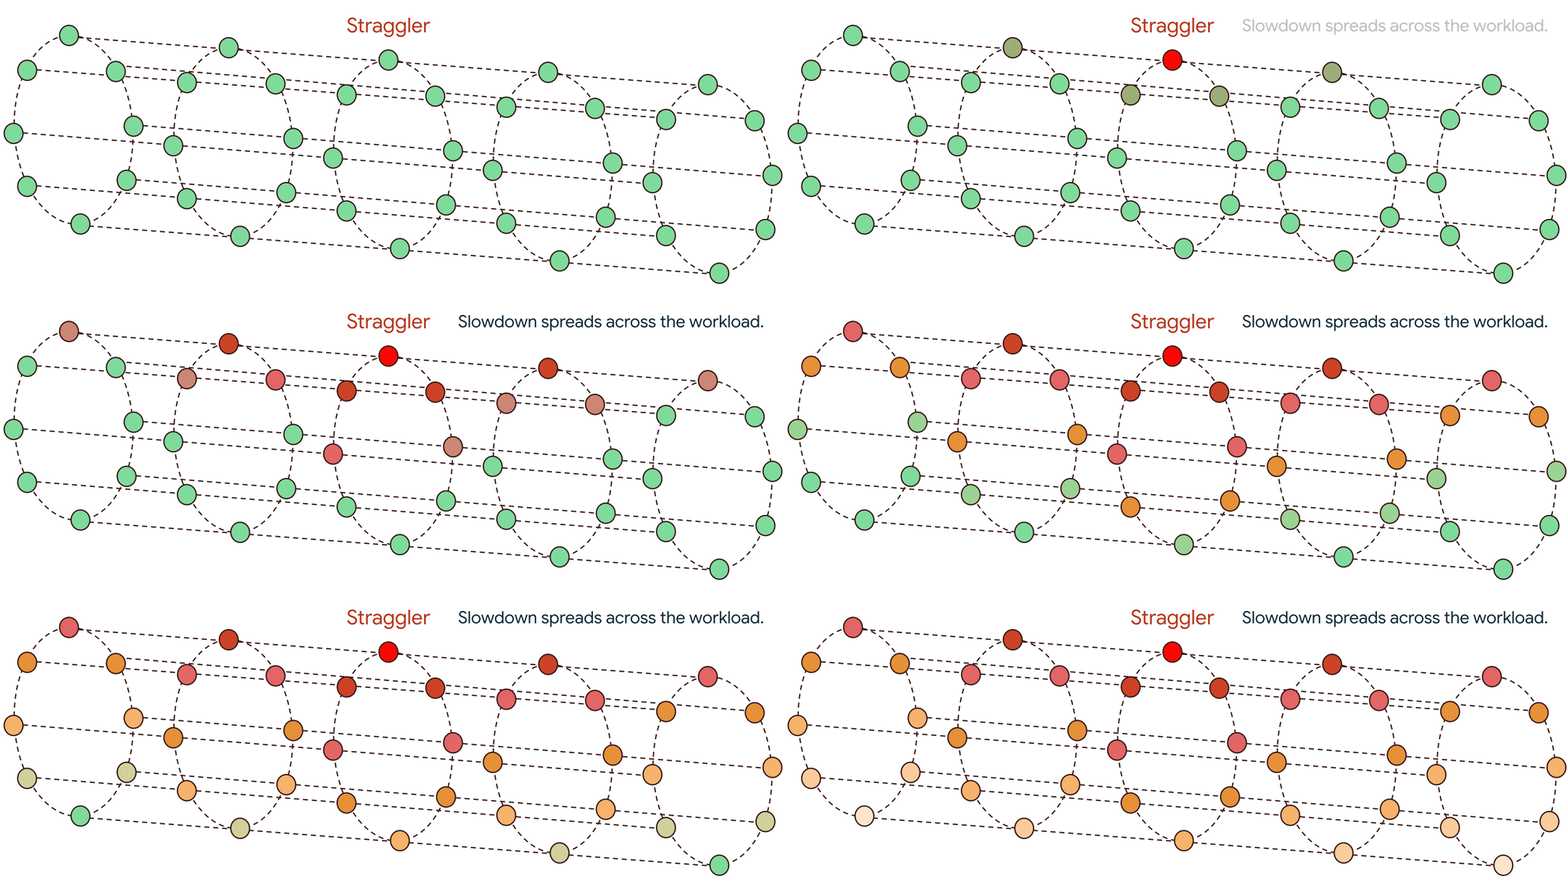
The domino effect of a single straggler
Large-scale distributed training is a synchronous process where thousands of accelerators work in lockstep. Each training step consists of a computation phase to generate local updates (like gradients), followed by a communication phase where these updates are exchanged and aggregated across all nodes, often using a collective operation like an all-reduce. This creates a critical data dependency: no accelerator can begin the next step until it has received the aggregated updates from all its peers.

If a single straggler is slow, it delays its contribution, forcing thousands of healthy accelerators to sit idle. This delay isn’t a one-time penalty; it propagates to the next step, creating a repeating cycle of inefficiency that significantly degrades overall performance. Sometimes, a single straggler can cause a 60-70% drop in workload performance. Such slowdowns can arise from a wide range of issues, from hardware faults like a thermally throttled GPU to subtle software bugs anywhere in the stack.
Pinpointing the source of a slowdown is often the hardest part of the recovery process. The state-of-the-art for this task has traditionally been a painful, manual debugging process requiring engineers to painstakingly scan metrics across thousands of nodes or run targeted, iterative tests like pairwise performance benchmarks to bisect the system. This tedious hunt can often take hours, if not days, to find the needle in the haystack.
- aside_block
- <ListValue: [StructValue([(‘title’, ‘$300 in free credit to try Google Cloud infrastructure’), (‘body’, <wagtail.rich_text.RichText object at 0x7f3867241730>), (‘btn_text’, ‘Start building for free’), (‘href’, ‘http://console.cloud.google.com/freetrial?redirectPath=/compute’), (‘image’, None)])]>
Beyond monitoring: Causal analysis for straggler detection
Conventional monitoring tools often fail to pinpoint stragglers because they focus on metrics that provide an incomplete picture. Job-wide metrics, like the total time per training step, are effective for detecting a problem but offer no help with localizing it; they confirm a slowdown is happening but can’t pinpoint the source. Low-level metrics on individual nodes, like GPU utilization or network round-trip time, are also misleading. A node can have a perfectly healthy network connection but still be a straggler if a software bug prevents it from sending data on time.
These methods fail because they analyze components in isolation. Our approach to straggler detection is built on the principle of causal analysis, understanding the system as an interconnected graph of time-sensitive interactions. It’s an always-on service that passively monitors GPU clusters, requiring no action from customers to run diagnostics, and it works in two main steps:
Step 1. Construct the Communication Graph: The service begins by passively observing network traffic to build a real-time map of how all the nodes in a workload are communicating. This directed graph shows the flow of information and, critically, the pathways through which a slowdown can propagate.
Step 2. Trace the Slowdown to its Source: With the graph established, the system employs a sophisticated graph-traversal algorithm to trace the causality of the performance degradation. The core question this traversal answers is: is a node slow because it is waiting for another underperforming node, or is it the original source of the slowdown?
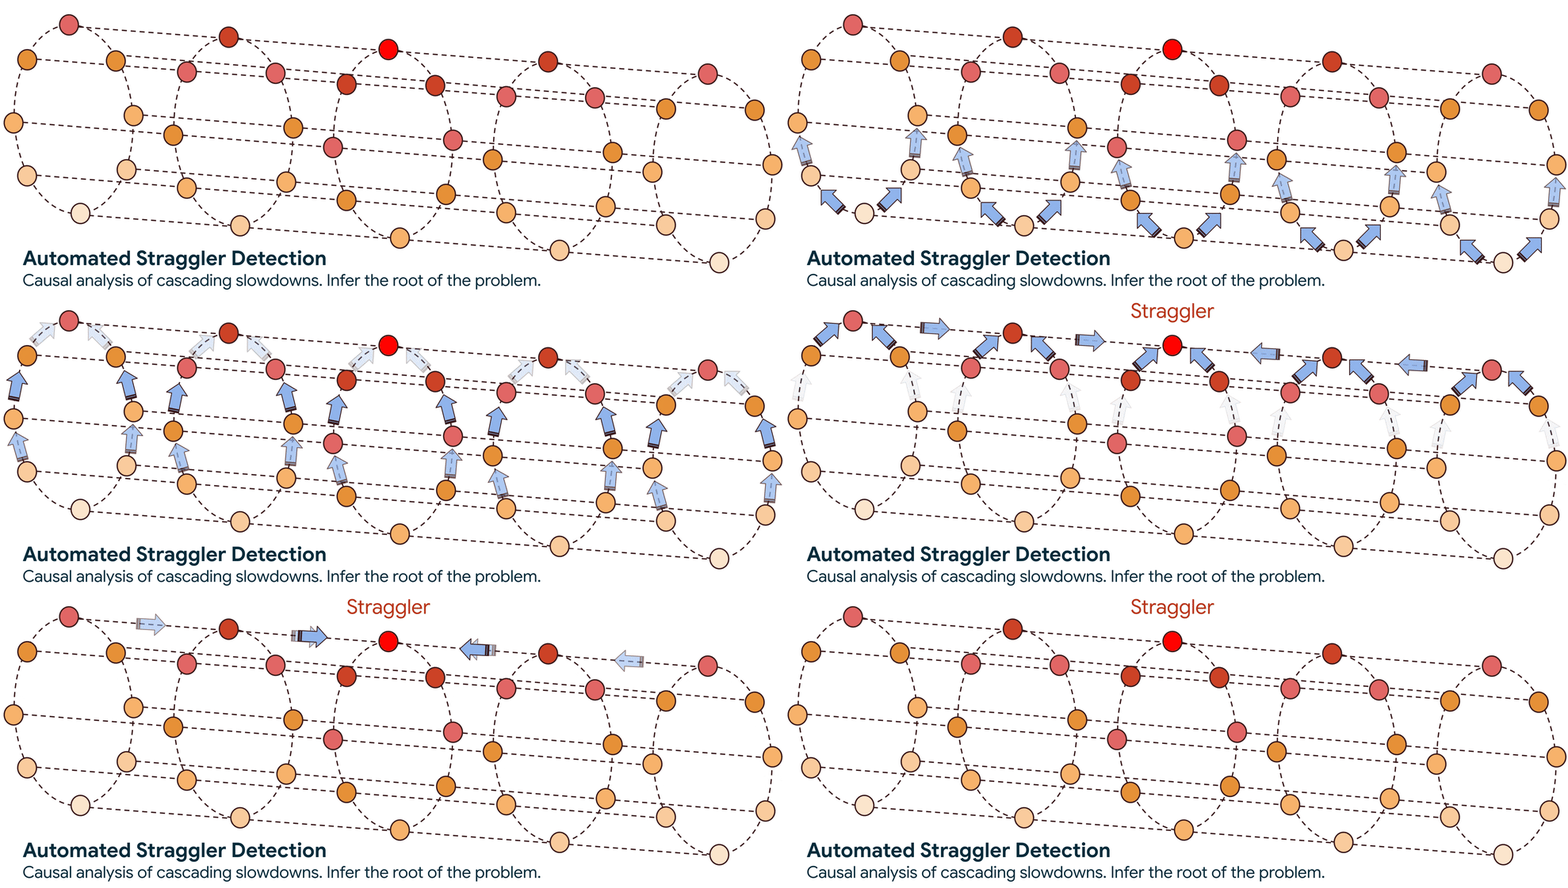
This automated approach reduces the search scope from thousands of nodes to a handful and cuts the search time from days to minutes. Once a straggler is identified, the service flags it so you can take action, such as cordoning the node and rescheduling the workload onto healthy infrastructure.
Real-world impact: Accelerating AI innovation
This automated approach is already delivering a significant impact for companies training frontier models on Google Cloud.
One of these companies is Magic, which partnered with Google to develop their frontier LLM with 100M token context windows trained across thousands of GPUs. Prior to Google’s automated straggler detection algorithm, the process for identifying straggler nodes required a lot of manual observability and troubleshooting.
Eric Steinberger, Magic’s Co-founder and CEO, described a challenging situation they faced: “Magic’s hero workload running across 8,000 GPUs was experiencing severe performance degradation over a period of 40 hours. Debugging this required access to precise low-level device and networking performance statistics.” Eric explained how the automated service provided a swift resolution. “Google’s automated straggler detection was able to identify straggler nodes, and their team was available 24/7 until the issue was resolved. We now have straggler detection enabled by default.”
The Allen Institute for AI (Ai2), whose open-sourced language models were trained on Google Cloud, saw a similar boost in research productivity. Sophie Lebrecht, Ai2 COO, highlighted the challenge their teams faced. “Previously, our teams wasted precious cycles trying to pinpoint the exact source of a node and/or GPU failure during our lengthy training runs.” Sophie explained how the new capability changed their workflow. “Straggler detection on GCP was a big productivity boost for our ML research team… We’ve been able to increase our development velocity significantly with straggler detection.”
Get started: Using automated straggler detection
Automated straggler detection is an always-on service offered within Google Cloud’s Cluster Director, passively monitoring your GPU clusters and automatically flagging potential stragglers that might be slowing down your workload.
When you experience a performance slowdown, you can quickly check the results in your dashboard:
-
Navigate to the Dashboards page in the Google Cloud console.
-
Find and click on the Cluster Director Health Monitoring dashboard.
-
Review the Straggler Detection section to see the Suspected Straggler Instances table.
This table provides a simple, actionable list of nodes that are likely causing the slowdown, allowing you to take immediate action. For a detailed guide on interpreting the results and troubleshooting steps, visit our documentation on how to troubleshoot slow performance.
Read More for the details.
