
GCP – System-centric monitoring and observability for SAP workloads running on Google Cloud
Managing complex SAP landscapes can feel like navigating a maze. You’re juggling application performance, database health, infrastructure stability, and more, all while striving to ensure seamless business applications. Today, we’re excited to announce new observability and monitoring functionality in Workload Manager to provide SAP customers with purpose-built tools that bridge gaps in data and provide a unified view of SAP environments across all layers of their cloud environments.
Workload Manager is not intended to replace your existing SAP monitoring tools, but rather complement them by providing a broader view of your SAP systems and enabling you to more easily correlate application-level insights with infrastructure performance and events.
Expanding visibility in complex SAP environments
Traditional SAP monitoring excels at providing detailed information at the application and database level. Metrics about transaction performance, user activity, and application logs are readily available. However, understanding the relationship between this application data and the underlying infrastructure can sometimes require additional effort. For example, a slowdown in transaction processing might be due to a database issue, a network bottleneck, or even a problem with the underlying virtual machine. While existing tools provide valuable insights, correlating application performance with infrastructure health can be a time-consuming process or may require toggling between different monitoring platforms and manual efforts.
- aside_block
- <ListValue: [StructValue([(‘title’, ‘Try Google Cloud for free’), (‘body’, <wagtail.rich_text.RichText object at 0x3eb0e270c9d0>), (‘btn_text’, ‘Get started for free’), (‘href’, ‘https://console.cloud.google.com/freetrial?redirectPath=/welcome’), (‘image’, None)])]>
Creating a system-centric, unified view with Workload Manager
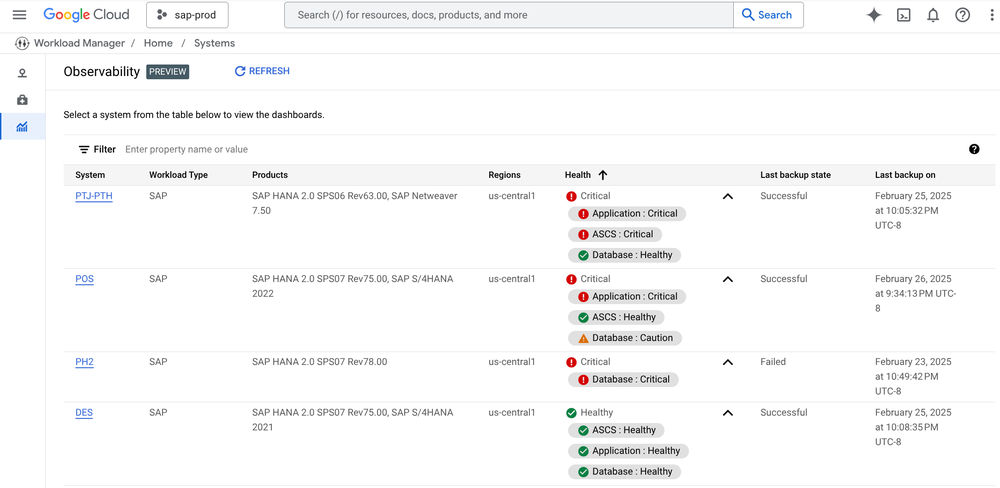
After enabling the necessary functionality in Google Cloud’s Agent for SAP, you can navigate to the main Observability dashboard to see an overview of your SAP systems and the overall health status of each system and sub-layer. The health status is calculated using a variety of metrics from SAP Netweaver instances, SAP HANA databases, pacemaker clusters, and the availability of the underlying infrastructure hosting them.
Clicking on a system will take you to the system Overview page, where you can visualize the components of the system and see the current health status for each instance included. The Health Insights table will summarize any health issues that are currently detected, and the Maintenance Events table displays any upcoming maintenance for supported machine types.

The “Applications” and “Databases” tabs behave similarly, and help you correlate key performance indicators from your SAP applications with metrics from your VMs, storage, network, and other Google Cloud services such as the following:
-
Availability: GCE Instance Availability, SAP NetWeaver and SAP HANA instance status, SAP NetWeaver and SAP HANA process status and Pacemaker Cluster nodes and resource status.
-
Performance: GCE Instance CPU and memory utilization, operating system processes by CPU and memory and information about swap I/O operations on the operating system.
-
Storage: SAP related file systems usage, disk space utilization and usage, disk throughput and disk IOPS.
-
Networking: Information about network traffic and network packages.
-
Netweaver: CPU and memory utilization by SAP NetWeaver process, response time by processes in the SAP NetWeaver instance, SAP NetWeaver sessions and RFC connections by type, SAP NetWeaver process utilization per work process type and information for each SAP NetWeaver process type for each respective queue in the system.
-
HANA: SAP HANA System Replication status, SAP HANA System Replication latency, memory usage in the SAP HANA Database by type, information about idle and running connections in the SAP HANA database and top schemas by record count in the SAP HANA database.
-
Backups: Information related to Backint backups including Backup/Recovery success rate, Backup/Recovery average MBps for all operations and historical data about both Backup/Recovery status and throughput.
New Event Annotations built specifically for SAP allow you to surface system events directly on monitoring dashboards to help empower you to quickly identify the root cause or see the impact of events on your system’s performance and health. These events are also now available outside of Workload Manager in Cloud Monitoring dashboards.
SAP Availability:
-
Pacemaker cluster:
-
Pacemaker cluster node status
-
Pacemaker cluster resource status
SAP HANA Database:
-
SAP HANA instance status
-
SAP HANA service status
SAP NetWeaver:
-
SAP NetWeaver instance status
-
SAP NetWeaver service status
SAP Operations:
-
SAP HANA System Replication status
-
SAP HANA Backup status
-
SAP HANA Data backups
-
SAP HANA Log backups
For example, in the following screenshot we can see how a SAP HANA database failover impacted the database availability and see the series of events as the Pacemaker cluster moved the database operations to the secondary node.

Other key features and benefits:
-
Comprehensive metrics: The solution collects a wide range of metrics from your SAP applications and Google Cloud infrastructure, but if you are looking for more, you can create your own custom queries and add the metrics to your custom dashboards inside Workload Manager Observability.
-
Customizable dashboards: Modify the dashboards to create alternative views to help visualize what matters most to your business and allow for faster identification of critical issues
-
Alerting and notifications: The dashboards are natively integrated with Cloud Monitoring and Alerting. You can set up alerts for specific metrics and receive notifications when thresholds are breached
-
Automated system discovery: The Agent for SAP automatically identifies and reconciles your SAP instances and resources when enabled, saving you valuable time and avoiding manual tagging or labeling
Getting started
Ready to experience the benefits of a single-pane-of-glass for SAP observability on Google Cloud? You can view detailed documentation and instructions on how to get started and the supported architectures here. The observability service in Workload Manager is available at no additional cost, but the underlying metrics and logs are subject to costs associated with Cloud Monitoring and Cloud Logging. You can view an estimated cost for the required features that must be enabled here.
If you would like assistance onboarding or would like a demo or more information, please contact your account representative or Google Cloud support and we will be in touch.
Looking ahead
We are committed to continuously improving SAP observability on Google Cloud and plan on adding new features and more correlation capabilities and insightful visualizations.
Read More for the details.

