GCP – Lock Statistics: Diagnose performance issues in Cloud Spanner
A real-world scenario
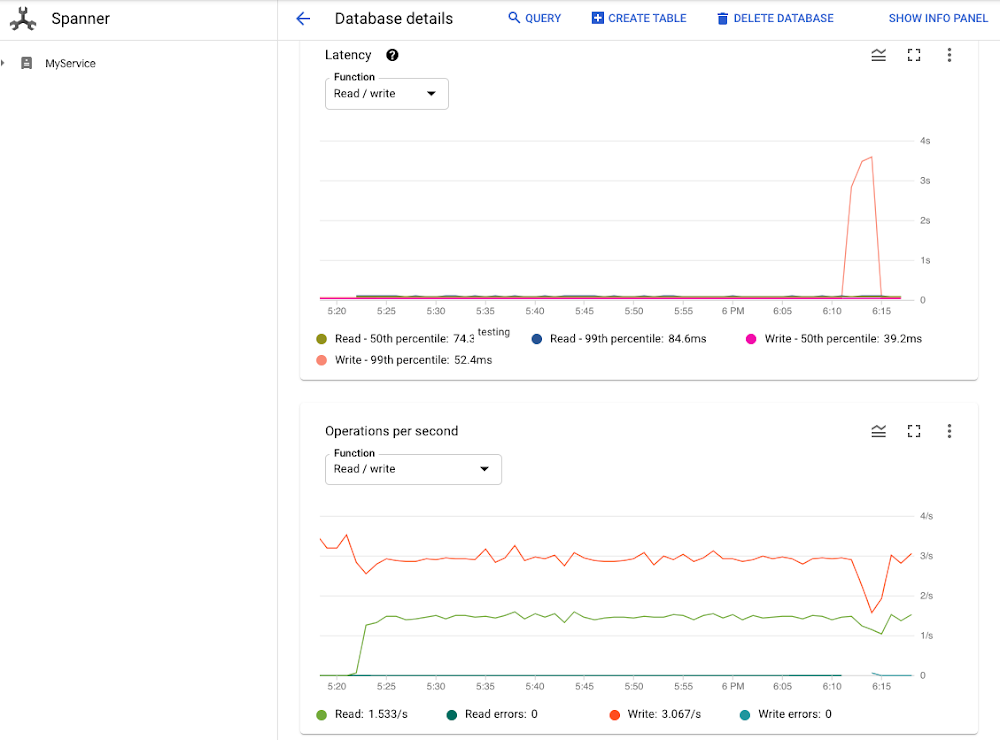
Imagine you are working on an e-commerce application, powered by a Cloud Spanner database. The app is performing as expected and your transactions are executing with low latency. One day, you hear a complaint that your app has slowed down, so you decide to investigate. One possibility is that the problem could be a database issue. You check the Cloud Spanner monitoring graph and notice that the 99th percentile write latency has skyrocketed and that has also impacted throughput.

You want to investigate the root cause of this latency spike. You know that there’s no recent configuration or schema change to the database. The only thing you can think of is the new deployment a few hours ago that might have introduced a new access pattern. You think there might be something suspicious with the transactions that were rolled out with that deployment. But how can you find the smoking gun to prove it? How can you find out whether lock conflicts are causing the latency spike? If lock conflicts are indeed the culprits, then which table cells in the database are transactions trying to lock?
Cloud Spanner and Locking
The good news is that Cloud Spanner’s introspection tools and, in particular, the recently added Lock Statistics feature, can help you answer these questions.
Cloud Spanner – Google’s fully managed horizontally scalable relational database service, offers the strictest concurrency-control guarantees, so that you can focus on the logic of the transaction without worrying about data integrity. To give you this peace of mind, and to ensure consistency of multiple concurrent transactions, we use a combination of shared locks and exclusive locks at the table cell level. And, as you know, with locks comes the potential for lock conflicts. When several transactions try to take a lock on the same cell, lock conflicts can occur which can lead to a performance hit on your database.
What is Lock Statistics
Lock statistics is another introspection tool we recently added to the collection of features that help you analyze and solve issues in your Cloud Spanner database. As its name suggests, Lock Statistics exposes data about locks, lock wait times, which table cells are involved in locks, and so on. As with the other introspection tools, this data is exposed in Lock Statistics through a set of built-in statistics tables.
-
Aggregated Lock Statistics Table. The aggregated table contains the total lock wait time for every 1-minute, 10-minutes, and 60-minutes period. The total lock wait time can be used to monitor overall application health and correlate with latency spikes.
-
Top Lock Statistics Table. The top statistics table contains sampled cells that incur the longest lock wait time for every 1-minute, 10-minutes, and 60-minutes period as well. The top statistics table helps to pin down specific data cells that incur the longest lock wait and identify the transactions that contend for locks.
Each row in the top lock statistics table represents the lock conflict which causes the longest wait time in the given time period. It reveals the start key of the locked key range, the wait time the transactions spent on the certain conflicts, and sample columns that had conflicts along with the lock mode. This helps you to pin down to specific data cells that incur the longest lock wait and identify what are the transactions which contend for locks.
You can find more details in the Introspection Tools section of the documentation, which covers query, transaction, read and lock statistics, as well as information on how to discover your oldest active queries.
Let’s now look at a pattern that combines Lock Statistics with other statistics in order to solve the problem we discussed in the example scenario.
How to use Lock Statistics
So, how can Lock Statistics help us in our quest to understand, and hopefully mitigate, the problem that led to the latency issues we discovered in our example scenario ? As you’ll see, the true power of the introspection tools collection comes out when we combine information from these tools over the time period during which our problems started to occur.
Are lock conflicts the root cause of the latency spikes?
To answer this question, we can examine average latency numbers and lock wait times during the time period when our problems first occurred.
Transaction Statistics provides commit latency information and Lock Statistics provides lock wait time information. If lock conflicts were the reason for the increase in commit latency, then you should be able to see a correlation when we join, for example, (TXN_STATS_TOTAL_10MINUTE) with lock statistics (LOCK_STAT_TOTAL_10MINUTE) as in the following example. The following sample query tells us the average commit latency and total lock wait time for every 10 minute interval.
Here are some sample results. When you see an increase of avg_commit_latency_seconds is highly correlated with the increase of total_lock_wait_seconds, then you know you are heading in the right direction.

This result shows the avg_commit_latency_seconds increased along with total_lock_wait_seconds during the same time period from 2020-11-12 18:10:00 to 2020-11-12 18:20:00 and dropped after that. Now that we’ve confirmed the lock wait time is closely related to the increase in write latency, it is time to move on to the next question.
Which rows and columns are causing the long lock wait during the specific time period?
To find out which rows and columns caused the spike in wait time we discovered in the preceding step, we can query the LOCK_STAT_TOP_10MINUTE table. The table has the row keys and sample columns that contribute the most to lock wait.

From the query result, we can see that the conflict happened on the Singers table at key SingerId=32. The Singers.SingerInfo is the column where the lock conflict occurred, when one transaction tried to acquire a ReaderShared lock and another transaction tried to acquire a WriterShared lock.
This is a common type of conflict when one transaction is trying to read a certain cell and another transaction is trying to write to the same cell. Refer to lock mode conflicts for more information on possible conflicts between different lock modes. Now that we know the exact data cell for which multiple transactions are contending, we’ll move on to the next question.
What transactions are accessing the columns involved in the lock conflict?
To find out which transactions tried to read or write the columns involved in the lock conflict, we join transaction statistics with lock statistics once again in the following query.
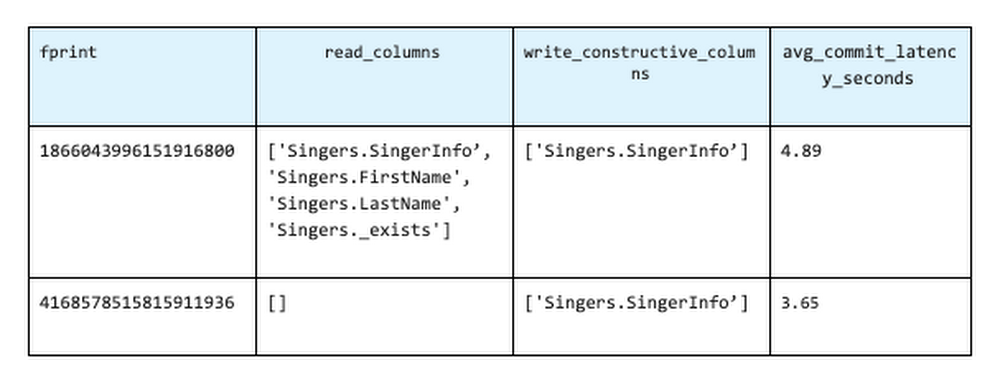
We can identify the transactions by retrieving fprint, read_columns, write_constructive_columns and avg_commit_latency_seconds from TXN_STATS_TOTAL_10MINUTE.
The query identifies the following transactions in the time period we are investigating:
-
Transactions reading from any of the columns that incurred a lock conflict while trying to acquire the ReaderShared lock.
-
Transactions writing to any of the columns that incurred a lock conflict while trying to acquire a WriterShared lock.

As the query results show, two transactions tried to access Singers.SingerInfo, which is the column that had lock conflicts during the period. Once the transactions causing the lock conflicts are identified, you can then try to identify issues in each transaction that are contributing to the problem.
Optimize Transaction Latency By Applying Best Practices
After you’ve successfully identified the transactions that contend for the locks, you can apply the Transaction Best Practices to mitigate the lock conflict.
Reviewing the new transactions, you find out that the Data Manipulation Language (DML) statements in the transactions aren’t conditioned on the primary key, SingerId, causing a full table scan and locking the table until the transaction is committed. If we know the SingerId, we can update the WHERE clause in the DML to condition on the SingerId. If we don’t know the IDs for the rows to be updated, we can also consider using a separate read-only transaction to fetch the IDs first, and then send another read-write transaction to update the rows based on the IDs.
Summary
In summary, Cloud Spanner now provides visibility into lock conflicts with the introduction of lock statistics. Check out the Lock Statistics documentation for more details and explore the other Introspection Tools to help you troubleshoot and improve the performance of your Cloud Spanner instance.
Read More for the details.


