GCP – Introducing the Log Analytics query builder: Easier analytics for your logs
As a DevOps engineer, Site Reliability Engineer, or application developer, how many times have you wrestled with complex queries to get the insights you need? Have you wished that there was an easier way to troubleshoot, identify root causes, and verify fixes, without being a SQL expert? We hear you loud and clear. That’s why we’re thrilled to announce the general availability of the Log Analytics query builder, a powerful new tool designed to democratize access to your observability data in Google Cloud.
The challenge: When writing SQL is a bottleneck
Log Analytics lets you query logs, other telemetry types, and even transactional or business datasets from BigQuery in one place. However, for many users, writing SQL queries can be a significant hurdle. This is especially true when dealing with critical log data, where valuable information is often nested in JSON payloads with varying schemas. The time and effort required to write effective SQL can slow down troubleshooting and hinder the ability to diagnose issues efficiently.
The solution: An intuitive query-building experience
We designed the new query builder to break down these barriers, with an intuitive, UI-based experience that empowers users of all skill levels to get answers from their observability data quickly.
Our goals were simple:
-
Lower the barrier to entry: Get started with Log Analytics for troubleshooting without a steep learning curve.
-
Accelerate insights: Generate insights from your data faster, reducing the time and effort needed to create effective queries.
-
Simplify JSON parsing: Easily extract and analyze valuable data from JSON payloads in your logs.
-
Reduce the need for SQL: For many queries, you may not need to write a SQL, or use the builder to generate starting SQL and get a jump start to continue editing complex queries.
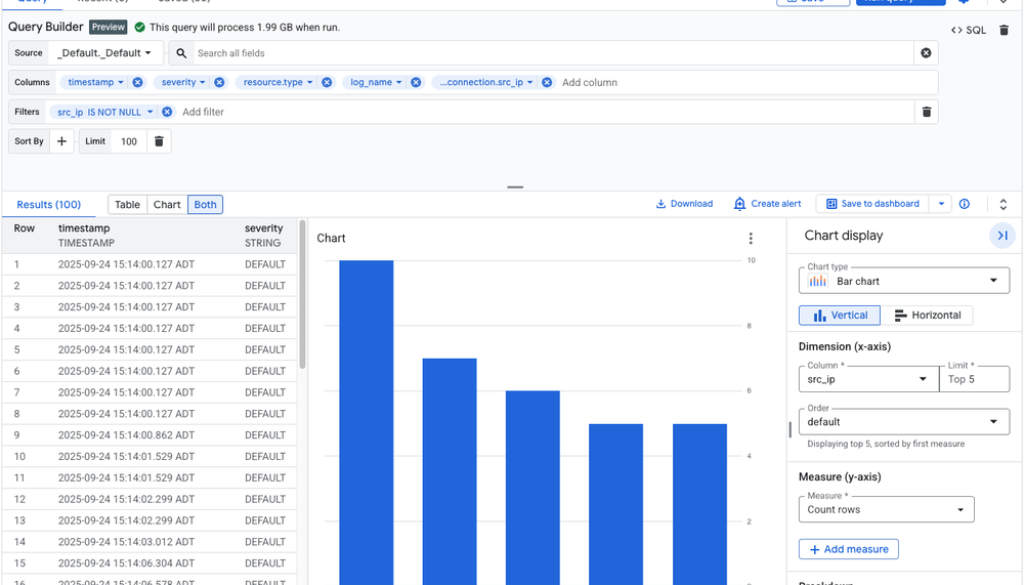
With the query builder, you can analyze, chart and alert on logs with a few clicks on the UI. Save time and effort by more easily writing a SQL query to help more quickly resolve an incident.
Figure: Query Builder Interface
Key features at a glance
The Log Analytics query builder is packed with features to streamline your workflow:
-
Search all fields: Simply paste an error message or string to search across all your data and quickly pinpoint the source of an issue.
-
Log schema preview: Query builder not only provides a log schema preview, but also provides inferred JSON key and value previews.
-
Intelligent value selection: The UI provides intelligent values for fields and filters, derived directly from your dataset, even including the nested fields in JSON.
-
Easier JSON handling: The query builder automatically discovers and suggests JSON schemas and values, allowing you to easily select and extract data without wrestling with
JSON_VALUE,JSON_EXTRACTorCAST. -
Powerful filtering and aggregation: Easily apply common SQL operators, aggregations (like counts, mean, percentiles), and group-by clauses through a simple UI.
-
Work with log scopes: Apply a query to a log scope by selecting the log scope from the view/scope picker.
-
Real-time SQL preview: If you want to see the underlying SQL, the query builder provides a real-time preview that updates as you build your query in the UI. You can switch to the code editor at any time to fine-tune your query.
-
Visualization dashboard: Instantly visualize your query results and save them to a dashboard with a single click.
Example: Search for `IAM_PERMISSION_DENIED` in pod name contains `event-exporter-gke-mod`
In this example, we searched for `IAM_PERMISSION _DENIED` message in a Kubernetes pod name containing `event-exporter-gke-mod`, and displayed the log id and text payload from the log entry.
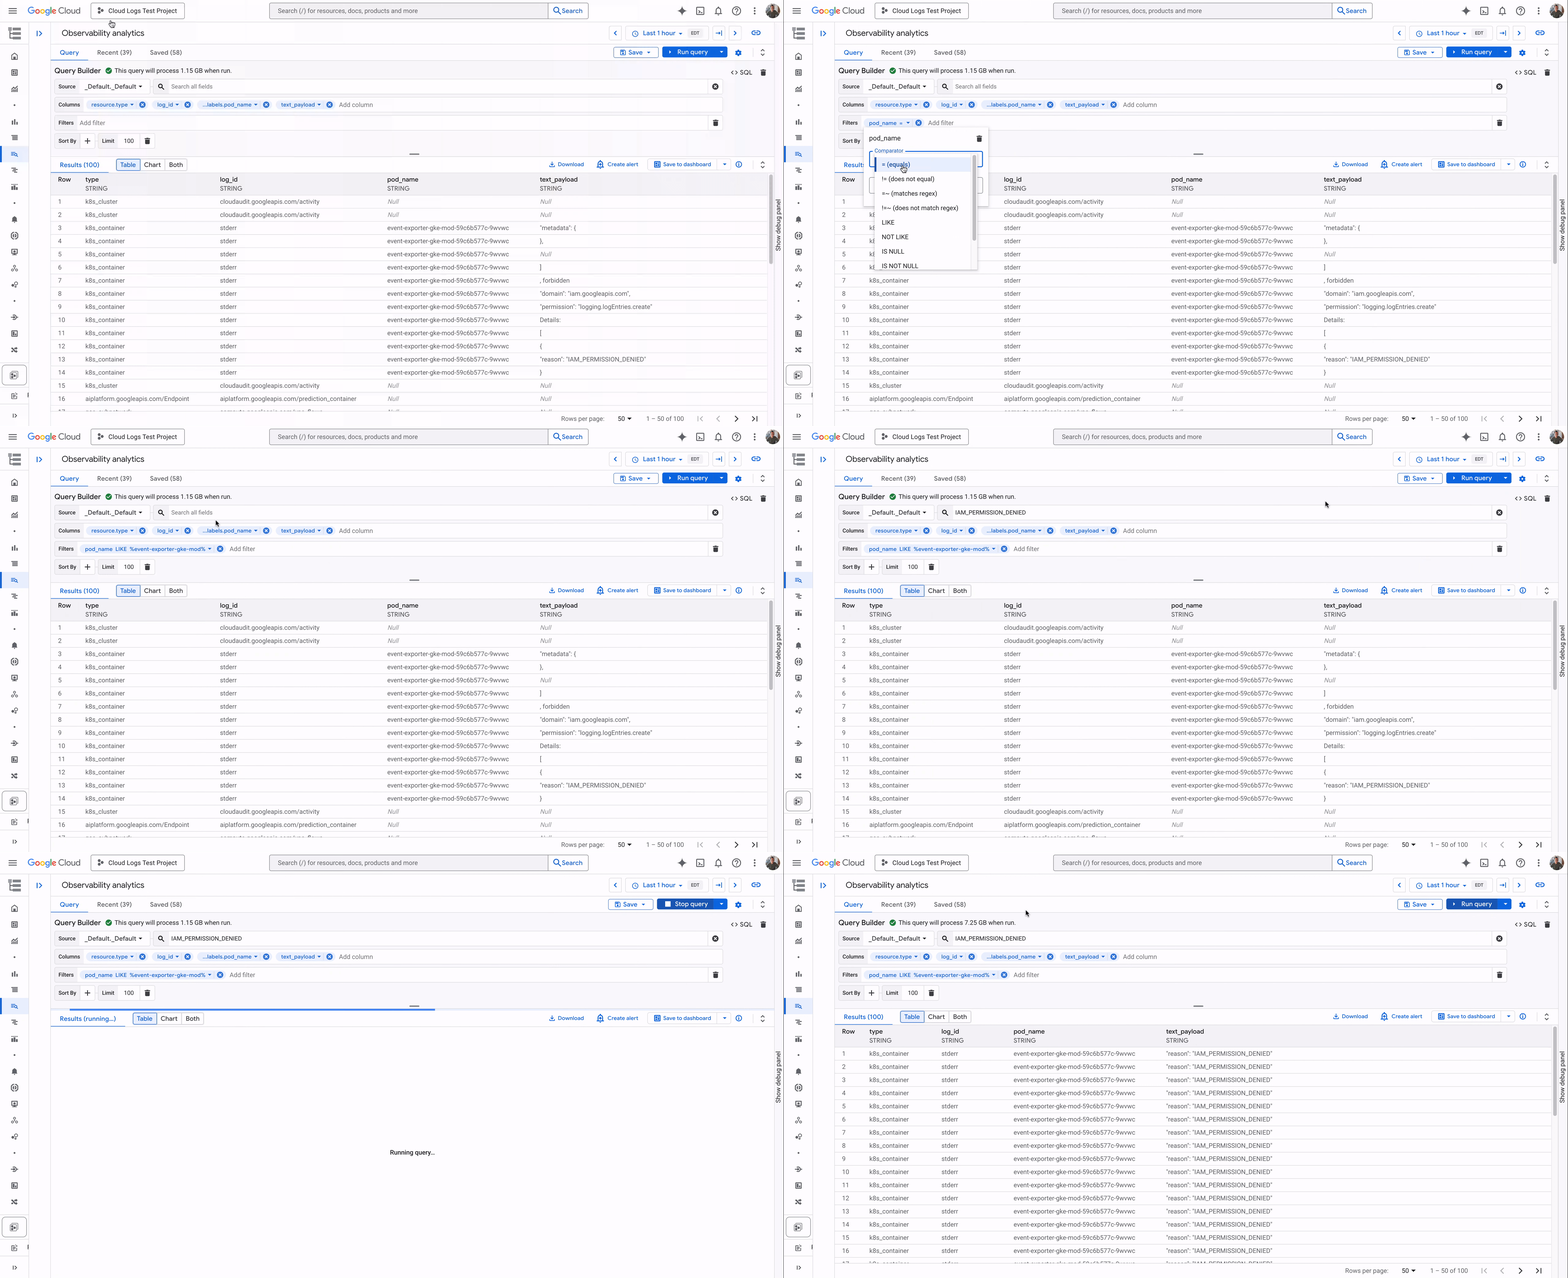
From this example, query builder generates the below SQL:
- code_block
- <ListValue: [StructValue([(‘code’, “WITHrn scope_query AS (rn SELECTrn *rn FROMrn `test-project.global._Default._Default` )rnSELECTrn resource.type,rn log_id,rn JSON_VALUE( resource.labels.pod_name ) AS pod_name,rn text_payloadrnFROMrn scope_queryrnWHERErn JSON_VALUE( resource.labels.pod_name ) LIKE ‘%event-exporter-gke-mod%’rn AND SEARCH(scope_query,rn ‘IAM_PERMISSIONS_DENIED’)rnLIMITrn 100″), (‘language’, ”), (‘caption’, <wagtail.rich_text.RichText object at 0x7f5e28338e50>)])]>
Example: Count log entries in groups
In this example, we grouped log entries by severity, resource type, and log ID, and counted the number of log entries in each group, in descending order of time.
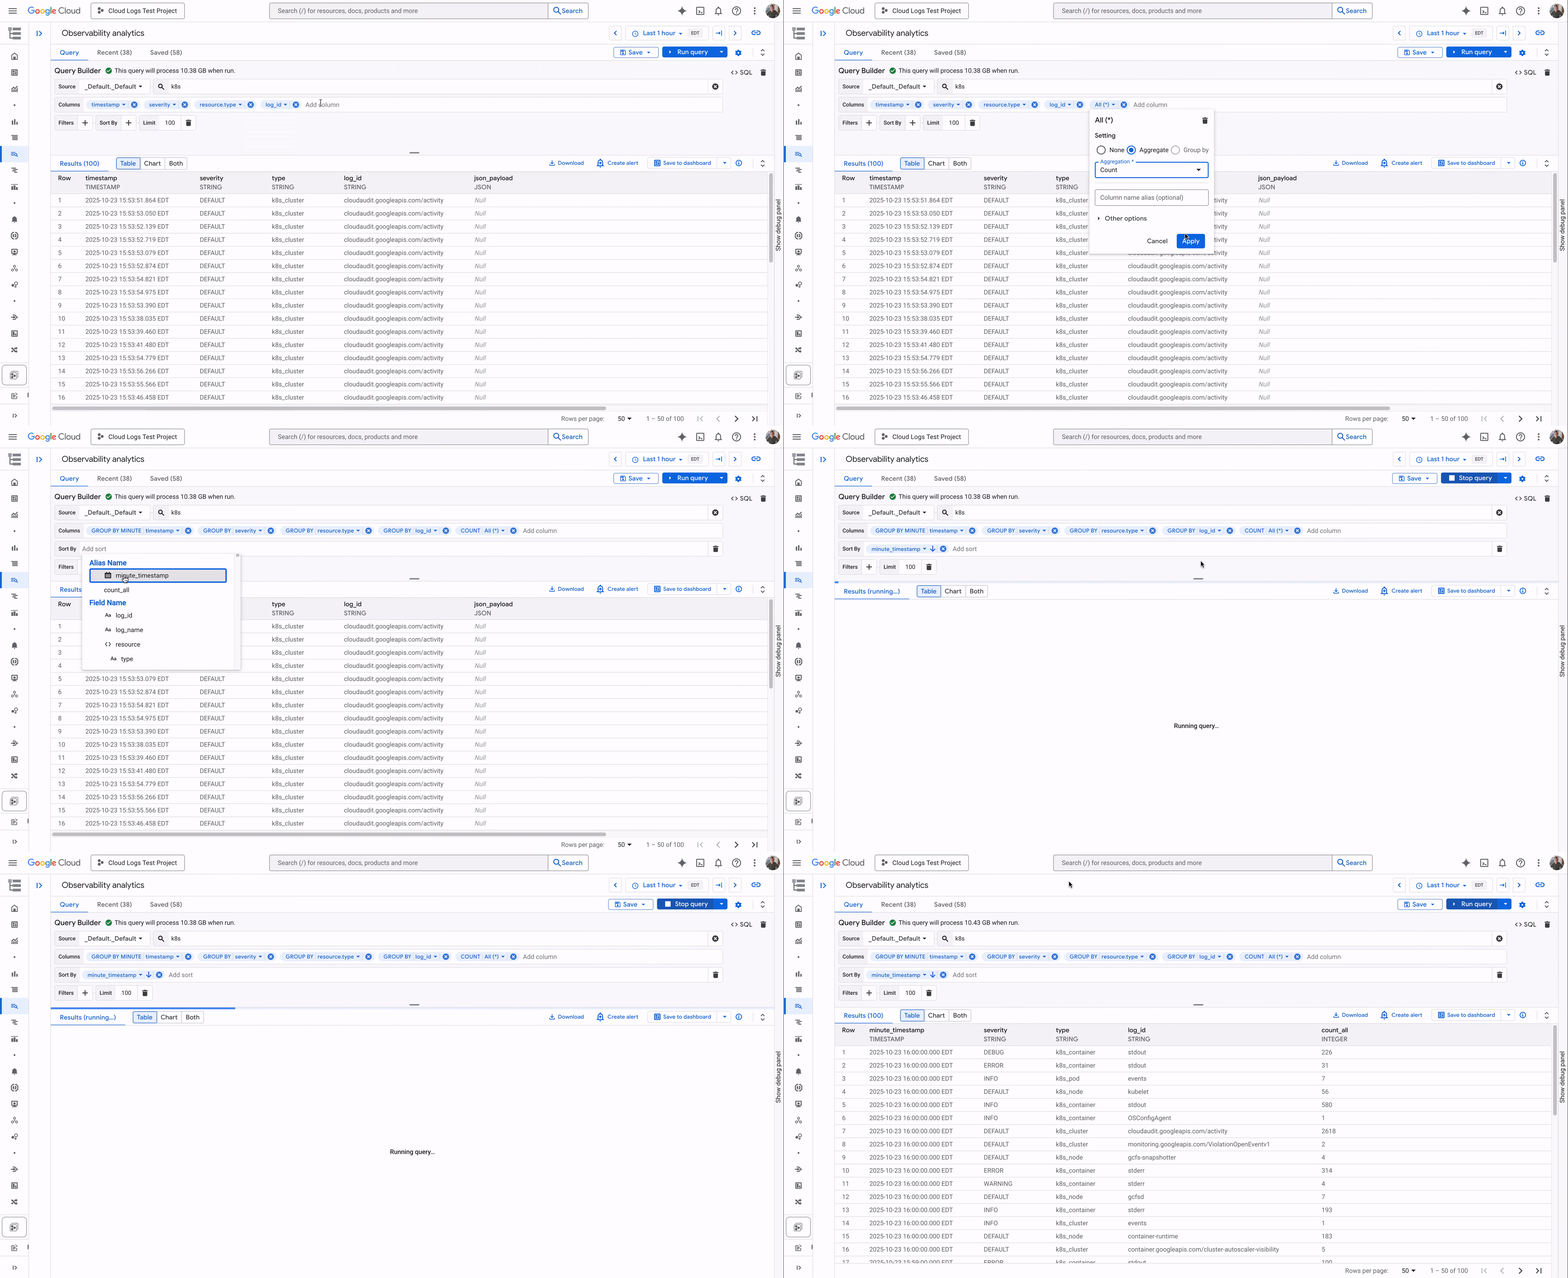
Query builder generates the below SQL representing this example:
- code_block
- <ListValue: [StructValue([(‘code’, “WITHrn scope_query AS (rn SELECTrn *rn FROMrn `test-project.global._Default._Default` )rnSELECTrn TIMESTAMP_TRUNC( timestamp, MINUTE ) AS minute_timestamp,rn severity,rn resource.type,rn log_id,rn COUNT( * ) AS count_allrnFROMrn scope_queryrnWHERErn SEARCH(scope_query,rn ‘k8s’)rnGROUP BYrn TIMESTAMP_TRUNC( timestamp, MINUTE ),rn severity,rn resource.type,rn log_idrnORDER BYrn minute_timestamp DESCrnLIMITrn 100″), (‘language’, ”), (‘caption’, <wagtail.rich_text.RichText object at 0x7f5e28338f10>)])]>
Demo: The power of query builder in action
This video demonstrates how to use the query builder to understand total external traffic by country with VPC flow log:
While building your query with the builder, you can always switch to SQL editor and see the generated SQL representing the query, as shown below:
- code_block
- <ListValue: [StructValue([(‘code’, “WITHrn scope_query AS (rn SELECTrn *rn FROMrn `test-project.global._Default._Default` )rnSELECTrn JSON_VALUE( json_payload.dest_location.country ) AS country,rn SUM( CAST( JSON_VALUE( json_payload.bytes_sent ) AS INT64 ) ) AS total_bytes_sent,rn SUM( CAST( JSON_VALUE( json_payload.packets_sent ) AS INT64 ) ) AS total_packets_sent,rn AVG( CAST( JSON_VALUE( json_payload.rtt_msec ) AS INT64 ) ) AS avg_rtt_msecrnFROMrn scope_queryrnWHERErn log_id = ‘compute.googleapis.com/vpc_flows’rn AND JSON_VALUE( json_payload.reporter ) = ‘SRC’rn AND JSON_VALUE( json_payload.dest_location.country ) IS NOT NULLrnGROUP BYrn JSON_VALUE( json_payload.dest_location.country )rnORDER BYrn total_bytes_sent DESCrnLIMITrn 100″), (‘language’, ”), (‘caption’, <wagtail.rich_text.RichText object at 0x7f5e28338d30>)])]>
You can also easily edit the query and advance the query as needed, while the foundations are built for you through the query builder experience.
To find more log analysis examples using the query builder, check out the user guide.
What’s next? The future of querying in Log Analytics
Query builder in Log Analytics is just the beginning. We have an exciting features planned, including:
-
More log scopes: We will soon support log scope containing views from multiple projects.
-
Trace in Analytics: We will introduce trace to become accessible and queryable from Log Analytics. Join trace and log data for advanced troubleshooting in the coming month.
-
Save and reuse Queries: Save your frequently used queries and access your recent query history, so you don’t have to start from scratch every time.
-
NL2SQL: Leverage the power of Gemini to ask questions in natural language and have the query builder generate the SQL for you.
Get started today!
Ready to say goodbye to your SQL headaches and experience a new level of simplicity and power in Log Analytics? The query builder is available now. Dive in and see how easy it is to get the answers you need from your observability data. We can’t wait to hear what you think!
Read More for the details.
