GCP – Application monitoring in Google Cloud: Bridging manual and AI-assisted troubleshooting
As developers and operators, you know that having access to the right information in the proper context is crucial for effective troubleshooting. This is why organizations invest a lot upfront curating monitoring resources across different business units: so information is easy to find and contextualize when needed.
Today we are reducing the need for this upfront investment with an out-of-the-box Application Monitoring experience for your organization on Google Cloud within Cloud Observability.
Application Monitoring consists of a set of pre-curated dashboards with relevant metrics and logs mapped to a user-defined application in App Hub. It incorporates best practices pioneered by Google Site Reliability Engineers (SRE) to optimize manual troubleshooting and unlock AI-assisted troubleshooting.
Application Monitoring automatically labels and brings together key telemetry for your application into a centralized experience, making it easy to discover, filter and correlate trends. It also feeds application context into Gemini Cloud Assist Investigations, for AI-assisted troubleshooting.
- aside_block
- <ListValue: [StructValue([(‘title’, ‘Try Google Cloud for free’), (‘body’, <wagtail.rich_text.RichText object at 0x3e333dc4f3d0>), (‘btn_text’, ‘Get started for free’), (‘href’, ‘https://console.cloud.google.com/freetrial?redirectPath=/welcome’), (‘image’, None)])]>
1. Application, service and workload dashboards
No more spending hours configuring application dashboards.
From the moment you describe your application in App Hub, Application Monitoring starts to automatically build dashboards tailored to your environment. Each dashboard comprises relevant telemetry for your application and is searchable, filterable and ready for deep dives — no configuration required.
The dashboards offer an overview of charts detailing the SRE Four Golden Signals: traffic, latency, error rate, and saturation. This provides a high-level view of application performance, integrating automatically collected system metrics across various services and workloads such as load balancers, Cloud Run, GKE workloads, MIGs, and databases. From this overview, you can then drill down into services or workloads with performance issues or active alerts to access detailed metrics and logs.
For example in the image below, a user defined an App Hub application called Cymbal BnB app, with multiple services and workloads. The flow below shows the automatically generated experience with golden signals, alerts and relevant logs.
Figure 1 – A user’s flow from an App Hub defined application (i.e. Cymbal BnB) to the automatic prebuilt Application Monitoring experience in Cloud Observability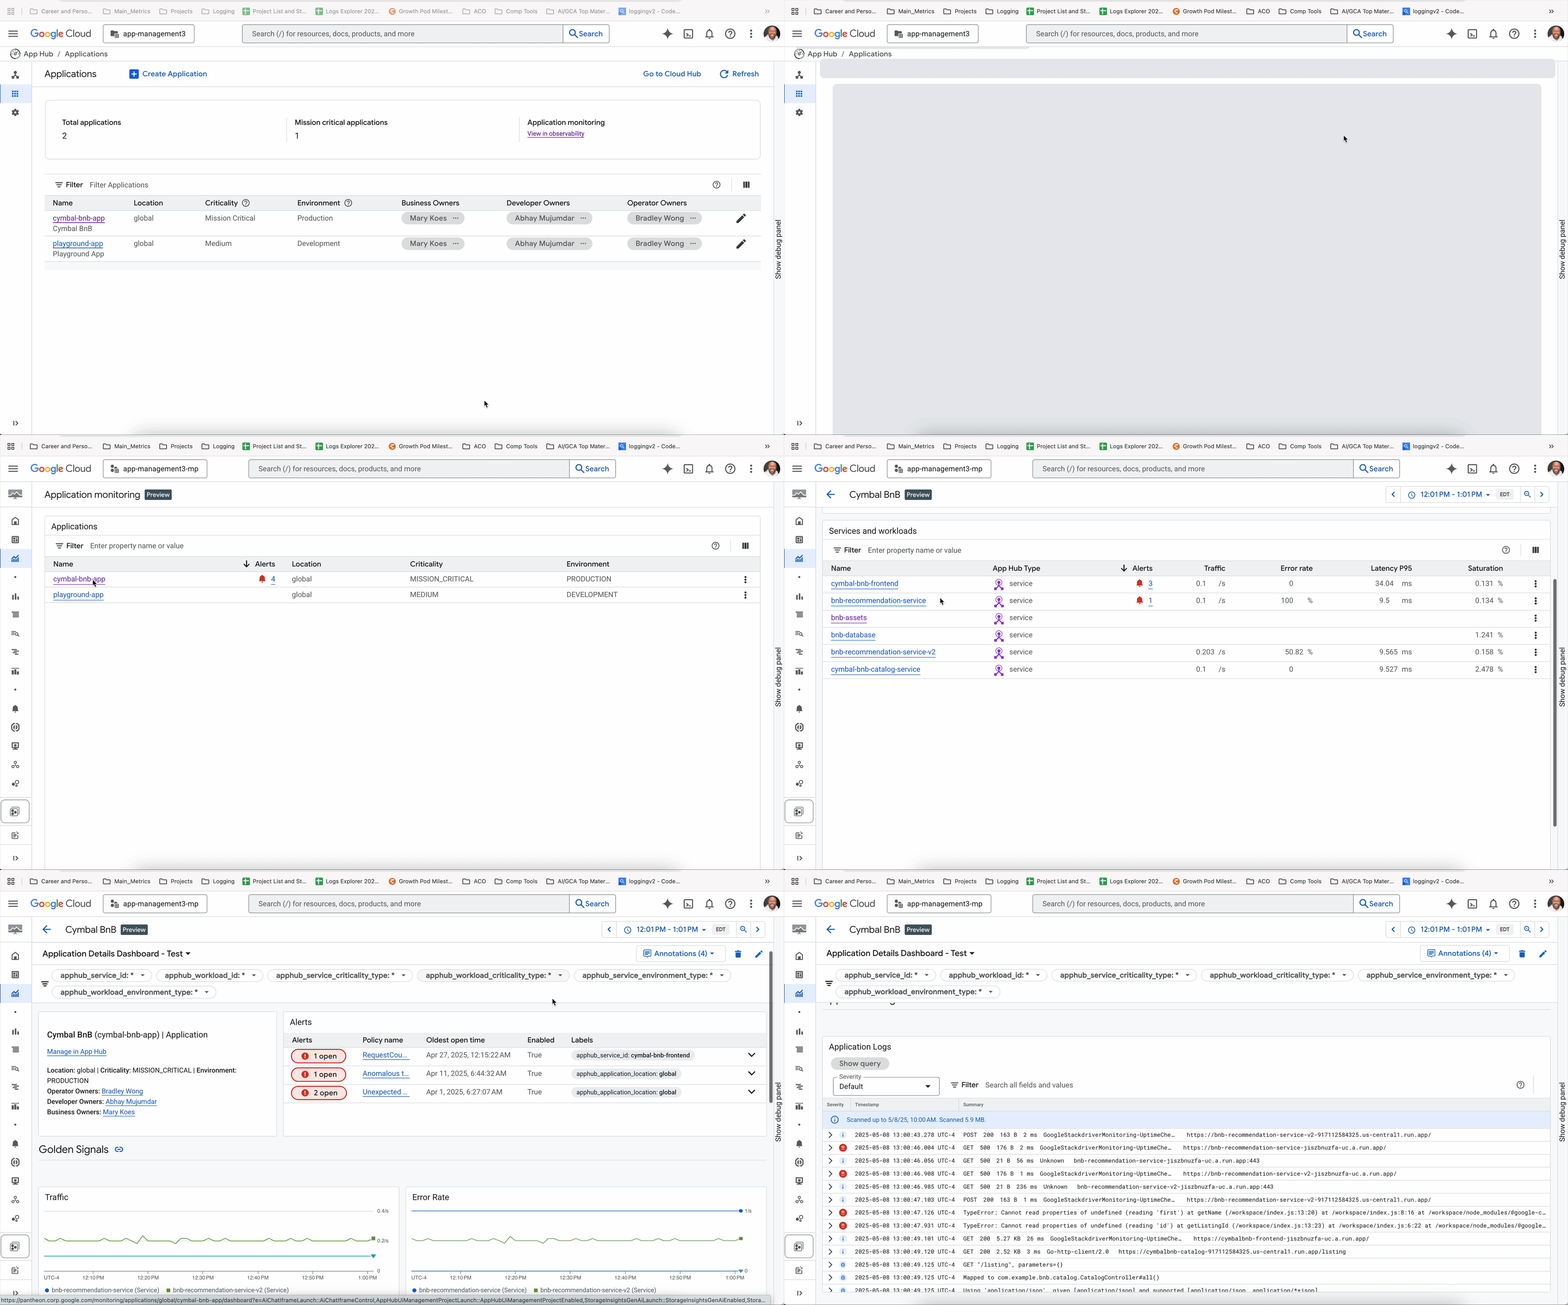
2. Labels and context propagation
See application labels propagated seamlessly across Google Cloud
Once Application Monitoring is enabled, your application labels are propagated across Google Cloud, so you can see and use them to filter and focus on the most essential signals across the logs, metrics and trace explorers.
Figure 2 – Logs Explorer showing application automatically tagged with application labels
Figure 3 – Metrics Explorer showing application labels automatically associated with metrics
Figure 4 – Trace Explorer showing AppHub label Integration
3. Gemini Cloud Assist Investigations
Troubleshoot issues faster with AI powered Investigations.
Gemini Cloud Assist’s investigation feature makes it easier to troubleshoot issues because application boundaries and relationships have been propagated into the AI model, grounding it in context about your environment.
Figure 5 – Seamless entry point into Gemini Cloud Assist powered Investigations from application logs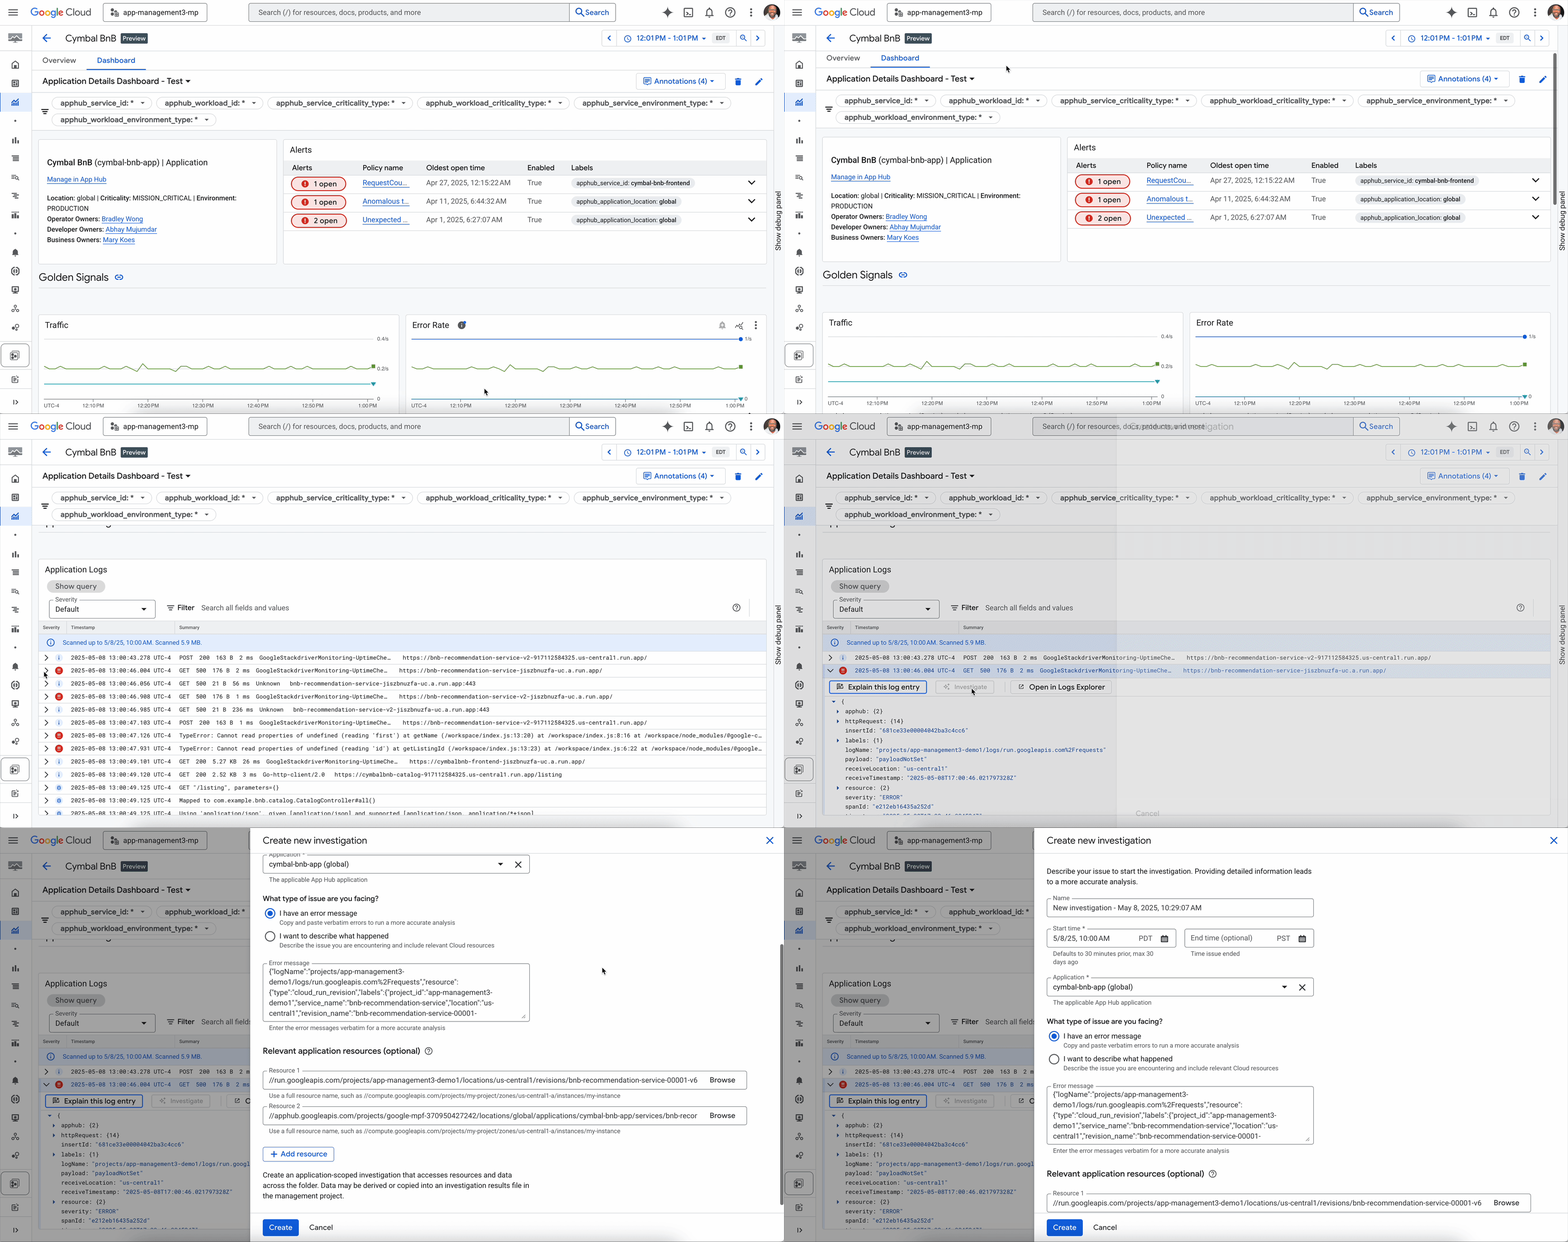
Note – Gemini Cloud Assist Investigations is currently in private preview
Try Application Monitoring today
The new Application Monitoring experience provides a low-effort unified view of application and infrastructure performance for your troubleshooting needs.
Take advantage of the new Google Cloud Application Monitoring experience by:
-
Visiting your Cloud console
-
Adding Services and Workloads to your Application
Navigating to Application Monitoring in Cloud Observability to see your automatically built experience
Enable your Gemini Cloud Assist SKU and sign up for the trusted tester program to get access to the Investigations experience
Related docs
-
Application Monitoring docs
-
AppHub docs
- Apphub coverage docs
Read More for the details.

