GCP – A guide to setting up monitoring for object creation in Cloud Storage
Cloud Storage provides worldwide, highly durable object storage that scales to exabytes of data. This means customers of all sizes and industries can use it to store and protect any amount of data for a range of use cases, such as websites, mobile applications, backup and restore, archive, and big data analytics. The objects are stored in containers called buckets.
Modern businesses typically collect data from internal and external sources at various frequencies throughout the day for batch and real-time processing. In most cases, if you’re an administrator or data engineer, it’s important to monitor when new files are received from an external source system and create alerts if the object count is less than expected. This helps in identifying any datasets that are missing due to source issues.
This post walks you through setting up monitoring and alerting on object creation in Google Cloud Storage using data access logs and logs-based metrics. Data access audit logs contain API calls that read the configuration or metadata of resources, as well as user-driven API calls that create, modify, or read user-provided resource data. With this type of monitoring and alerting, you can ensure data quality and identify source system issues.
Here’s a look at the architecture we’ll be using:
Here’s how to get started with monitoring and alerts.
1. Configure data access logs in your project
To access audit log configuration options in the Cloud Console, follow these steps:
-
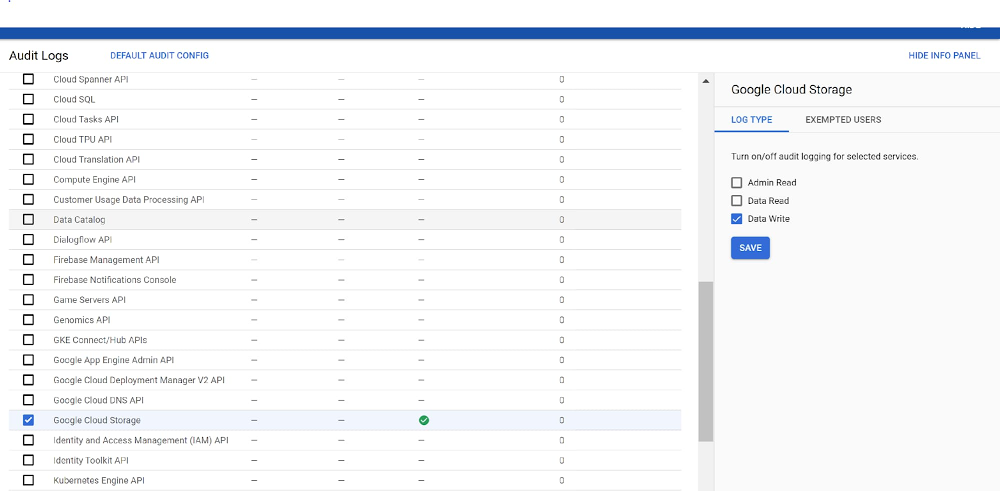
From the Cloud Console, select IAM & Admin > Audit Logs from the upper left-hand overflow menu. Go to the Audit Logs page.
-
Select an existing Google Cloud project, folder, or organization at the top of the page. In the main table on the Audit Logs page, select Google Cloud Storage by clicking on the box to the left of a service name in the Title column.
-
In the Log Type tab in the information panel to the right of the table, select Data Write that you wish to enable and then click Save.
After data access logs are enabled, every time you upload a file to the bucket you will be able to see a log created in your project.
2. Configure log-based metric
-
In the left pane, click Logging > Log-Based metric
-
Name the policy as Blog_demo.
-
Provide the filter condition, as shown in the screenshot below.
Note that the method name will be “storage.objects.create.” Replace bucket name with the name of the bucket you want to monitor and timestamp for which you want to monitor the logs.
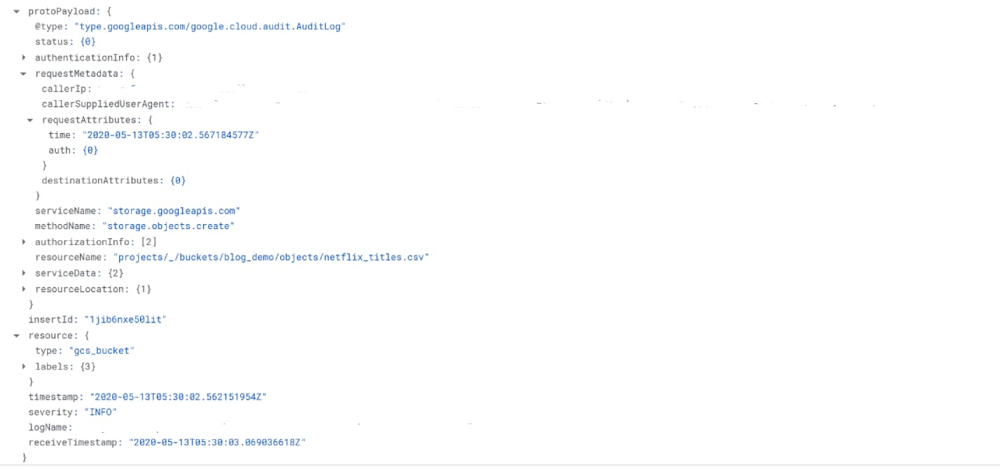
A typical log entry for such a filter will look like this:
3. Create an alert in Cloud Monitoring
- In the left pane, click Alerting > Create Policy.
- Name the policy as Blog_demo.
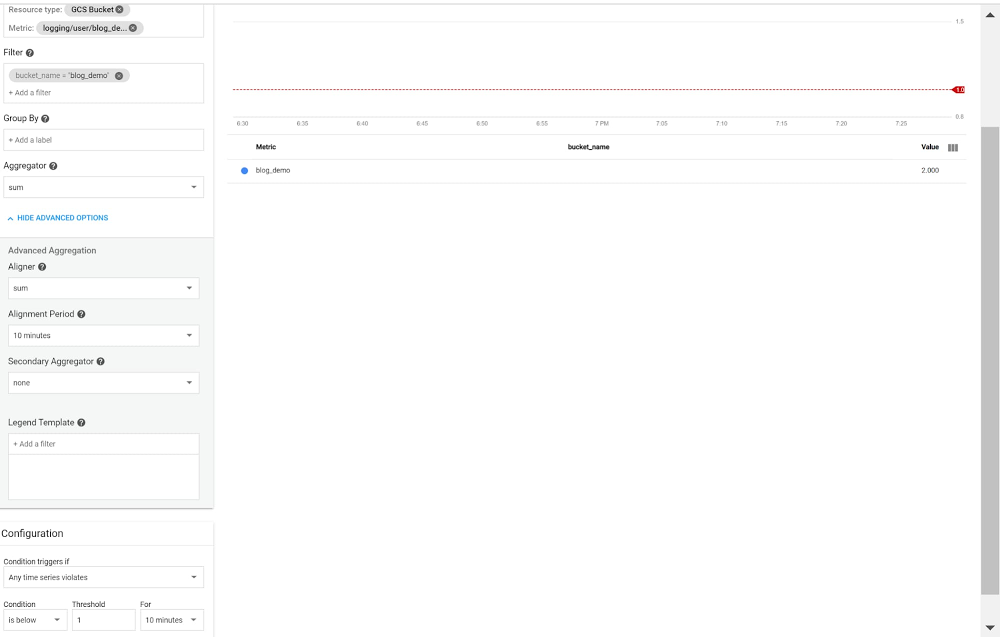
- Click Add Condition and create a condition for Cloud Storage data volume to fire an alert if no data is written within 10 minutes to the bucket.
Here’s how the data looks from within Cloud Monitoring:
As shown in the screenshot, the number of objects added to each bucket can be calculated by aligning the time series data into windows of 10 minutes each. For each window, the sum of all the underlying objects will give the final count.
The thresholds for each bucket can be set up separately and can be used to trigger alerts.
Learn more about data access logs and log-based metrics.
Read More for the details.
