Amazon Quick Suite browser extension now supports Amazon Quick Flows, enabling you to run workflows directly within your web browser, eliminating the need to manually extract information from each web page. You can invoke workflows that you’ve created or that have been shared with you, and pass web page content as input—all without leaving your browser.
This capability is great for completing routine tasks such as analyzing contract documents to extract key terms, or generating weekly reports from project dashboards that automatically notify stakeholders.
Quick Flows in browser extension is available now in US East (N. Virginia), US West (Oregon), Asia Pacific (Sydney), and Europe (Ireland). There are no additional charges for using the browser extension beyond standard Quick Flows usage.
To get started, visit your Chrome, Firefox or Edge store page to install browser extension and sign in with your Quick Suite account. Once you sign in, look for the Flows icon below the chat box to invoke your flows. To learn more about invoking Quick Flows in browser extension, please visit our documentation.
Amazon Connect provides two new evaluation question types to capture deeper insights on human and AI agent performance. Managers can now create questions that allow multiple answer selections, such as the products that the customer was interested in during a sales conversation. Additionally, managers can capture dates for customer and agent actions within evaluation forms. For example, you can record when a customer applied for a loan and when it was approved.
This feature is available in all regions where Amazon Connect is offered. To learn more, please visit our documentation and our webpage.
AWS announces a new cost allocation feature that uses existing workforce user attributes like cost center, division, organization, and department to track and analyze AWS application usage and cost. This new capability enables customers to allocate per-user monthly subscription and on-demand fees of AWS applications, such as Amazon Q Business, Amazon Q Developer, and Amazon QuickSight, to respective internal business units.
Customers should import their workforce users’ attributes to IAM Identity Center, the recommended service for managing workforce access to AWS applications. After importing the attributes, customers can enable one or more of these attributes as cost allocation tags from the AWS Billing and Cost Management console. When users access AWS applications, their usage and cost are automatically recorded with selected attributes. Cloud Financial Operations (FinOps) professionals can view and analyze costs in AWS Cost Explorer and AWS CUR 2.0, gaining visibility into how different teams drive AWS usage and costs.
Support for cost allocation using user attributes is generally available in all AWS Regions, excluding GovCloud (US) Regions and China (Beijing) and China (Ningxia) Regions.
Starting today, customers can use Amazon Managed Service for Apache Flink in Asia Pacific (Auckland) Region to build real-time stream processing applications.
Amazon Managed Service for Apache Flink makes it easier to transform and analyze streaming data in real time with Apache Flink. Apache Flink is an open source framework and engine for processing data streams. Amazon Managed Service for Apache Flink reduces the complexity of building and managing Apache Flink applications and integrates with Amazon Managed Streaming for Apache Kafka (Amazon MSK), Amazon Kinesis Data Streams, Amazon OpenSearch Service, Amazon DynamoDB streams, Amazon Simple Storage Service (Amazon S3), custom integrations, and more using built-in connectors.
You can learn more about Amazon Managed Service for Apache Flink here. For Amazon Managed Service for Apache Flink region availability, refer to the AWS Region Table.
The AI state of the art is shifting rapidly from simple chat interfaces to autonomous agents capable of planning, executing, and refining complex workflows. In this new landscape, the ability to ground these intelligent agents in your enterprise data is key to unlocking true business value. Google Cloud is at the forefront of this shift, empowering you to build robust, data-driven applications quickly and accurately.
Last month, Google announced Antigravity, an AI-first integrated development environment (IDE). And now, you can now give the AI agents you build in Antigravity direct, secure access to the trusted data infrastructure that powers your organization, turning abstract reasoning into concrete, data-aware action. With Model Context Protocol (MCP) servers powered by MCP Toolbox for Databases now available within Antigravity, you can securely connect your AI agents to services like AlloyDB for PostgreSQL, BigQuery, Spanner, Cloud SQL, Looker and others within Google’s Data Cloud, all within your development workflow.
Why use MCP in Antigravity?
We designed Antigravity to keep you in the flow, but the power of an AI agent is limited by what it “knows.” To build truly useful applications, your agent needs to understand your data. MCP acts as the universal translator. You can think of it like a USB-C port for AI. It allows the LLMs in your IDE to plug into your data sources in a standardized way. By integrating pre-built MCP servers directly into Antigravity, you don’t need to perform any manual configuration. Your agents can now converse directly with your databases, helping you build and iterate faster without ever leaving the IDE.
Getting started with MCP servers
In Antigravity, connecting an agent to your data is a UI-driven experience, eliminating the challenges we’ve all faced when wrestling with complex configuration files just to get a database connection running. Here’s how to get up and running.
1. Discover and launch
You can find MCP servers for Google Cloud in the Antigravity MCP Store. Search for the service you need, such as “AlloyDB for PostgreSQL” or “BigQuery,” and click on Install to start the setup process.
Launching the Antigravity MCP store
2. Configure your connection
Antigravity presents a form where you can add your service details such as Project ID and region. You can also enter your password or have Antigravity use your Identity and Access Management (IAM) credentials for additional security. These are stored securely, so your agent can access the tools it needs without exposing raw secrets in your chat window.
Installing the AlloyDB for PostgreSQL MCP Server
See your agents in action
Once connected to Antigravity, your agent gains a suite of “tools” (executable functions) that it can use to assist you, and help transform your development and observability experience across different services. Let’s take a look at a couple of common scenarios.
Streamlining database tasks with AlloyDB for PostgreSQL
When building against a relational database like PostgreSQL, you may spend time switching between your IDE and a SQL client to check schema names or test queries. With the AlloyDB MCP server, your agent handles that context and gains the ability to perform database administration and generate high-quality SQL code you can include in your apps — all within the Antigravity interface.
For example:
Schema exploration: The agent can use list_tables and get_table_schema to read your database structure and explain relationships to you instantly.
Query development: Ask the agent to “Write a query to find the top 10 users,” and it can use execute_sql to run it and verify the results immediately.
Optimization: Before you commit code, use the agent to run get_query_plan to ensure your logic is performant.
Antigravity agent using the MCP tools
Unlocking analytics with BigQuery
For data-heavy applications, your agent can act as a helpful data analyst. Leveraging the BigQuery MCP server, it can, for example:
Forecast: Use forecast to predict future trends based on historical data.
Search the catalog: Use search_catalog to discover and manage data assets.
Augmented analytics: Use analyze_contribution to understand the impact of different factors on data metrics.
Building on truth with Looker
Looker acts as your single source of truth for business metrics. Looker’s MCP server allows your agent to bridge the gap between code and business logic, for example:
Ensuring metric consistency: No more guessing whether a field is named total_revenue or revenue_total. Use get_explores and get_dimensions to ask your agent, “What is the correct measure for Net Retention?” and receive the precise field reference from the semantic model.
Instantly validating logic: Don’t wait to deploy a dashboard to test a theory. Use run_query to execute ad-hoc tests against the Looker model directly in your IDE, so that your application logic matches the live data.
Auditing reports: Use run_look to pull results from existing saved reports, allowing you to verify that your application’s output aligns with official business reporting.
Build with data in Antigravity
By integrating Google’s Data Cloud MCP servers into Antigravity, it’s easier than ever to use AI to discover insights and develop new applications. Now, with access to a wide variety of data sources that run your business, get ready to take the leap from simply talking to your code, to creating new experiences for your users.
To get started, check out the following resources:
Today, we’re announcing enhanced network policy capabilities in Amazon Elastic Kubernetes Service (EKS), allowing customers to improve the network security posture for their Kubernetes workloads and their integrations with cluster-external destinations. This enhancement builds on network segmentation features previously supported in EKS. Now you can centrally enforce network access filters across the entire cluster, as well as leverage Domain Name System (DNS) based policies to secure egress traffic from your cluster’s environment.
As customers continue to scale their application environments using EKS, network traffic isolation is increasingly fundamental for preventing unauthorized access to resources inside and outside the cluster. To address this, EKS introduced support for Kubernetes NetworkPolicies in the Amazon VPC Container Network Interface (VPC CNI) plugin, allowing you to segment pod-to-pod communication at a namespace level. Now you can further strengthen the defensive posture for your Kubernetes network environment by centrally managing network filters for the whole cluster. Also, cluster admins now have a more stable and predictable approach for preventing unauthorized access to cluster-external resources in the cloud or on-prem using egress rules that filter traffic to external endpoints based on their Fully Qualified Domain Name (FQDN).
These new network security features are available in all commercial AWS Regions for new EKS clusters running Kubernetes version 1.29 or later, with support for existing clusters to follow in the coming weeks. ClusterNetworkPolicy is available in all EKS cluster launch modes using VPC CNI v1.21.0 or later. DNS-based policies are only supported in EKS Auto Mode-launched EC2 instances. To learn more, visit the Amazon EKS documentation or read the launch blog post here.
Today, AWS announces PDF export and CSV data download capabilities for AWS Billing and Cost Management Dashboards. These new features enable you to export your customized dashboards as PDF files for offline analysis and sharing, and download individual widget data in CSV format for detailed examination in spreadsheet applications. With these capabilities, you now have more ways to distribute AWS cost insights across your organization, in addition to sharing dashboards with can-view or can-edit access.
Billing and Cost Management Dashboards allows you to export entire dashboards or individual widgets as PDF files directly from the console, eliminating the need for screenshots or manual formatting. The PDF export feature provides formatted reports that maintain consistent appearance and preserve dashboard layouts, making them ideal for sharing with stakeholders during board meetings, reviews, or strategic planning sessions. For detailed data analysis needs, you can export individual widget data in CSV format, enabling analysts to perform granular examination of specific cost metrics in their preferred spreadsheet tools.
AWS Billing and Cost Management Dashboards PDF and CSV export features are available at no additional cost in all AWS commercial Regions, excluding AWS China Regions.
To get started, visit the AWS Billing and Cost Management console and select “Dashboards” from the left navigation menu. For more information, see the AWS Billing and Cost Management Dashboards export user guide.
Building Generative AI applications has become accessible to everyone, but moving those applications from a prototype to a production-ready system requires one critical step: Evaluation.
How do you know if your LLM is safe? How do you ensure your RAG system isn’t hallucinating? How do you test an agent that generates SQL queries on the fly?
At its core, GenAI Evaluation is about using data and metrics to measure the quality, safety, and helpfulness of your system’s responses. It moves you away from “vibes-based” testing (just looking at the output) to a rigorous, metrics-driven approach using tools like Vertex AI Evaluation and the Agent Development Kit (ADK).
To guide you through this journey, we have released four hands-on labs that take you from the basics of prompt testing to complex, data-driven agent assessment.
Evaluating Single LLM Outputs
Before you build complex systems, you must understand how to evaluate a single prompt and its response. This lab introduces you to GenAI Evaluation, a service that helps you automate the evaluation of your model’s outputs.
You will learn how to define metrics, such as safety, groundedness, and instruction following. You will also learn how to run evaluation tasks against a dataset. This is the foundational step for any production-ready AI application.
aside_block
<ListValue: [StructValue([(‘title’, ‘Go to lab!’), (‘body’, <wagtail.rich_text.RichText object at 0x7fc07005beb0>), (‘btn_text’, ”), (‘href’, ”), (‘image’, None)])]>
Evaluate RAG Systems with Vertex AI
Retrieval Augmented Generation (RAG) is a powerful pattern, but it introduces new failure points: did the search fail to find the document, or did the LLM fail to summarize it?
This lab takes you deeper into the evaluation lifecycle. You will learn how to verify “Faithfulness” (did the answer come from the context?) and “Answer Relevance” (did it actually answer the user’s question?). You will pinpoint exactly where your RAG pipeline needs improvement.
aside_block
<ListValue: [StructValue([(‘title’, ‘Go to lab!’), (‘body’, <wagtail.rich_text.RichText object at 0x7fc07005b790>), (‘btn_text’, ”), (‘href’, ”), (‘image’, None)])]>
Evaluating Agents with ADK
Agents are dynamic; they choose tools and plan steps differently based on the input. This makes them harder to test than standard prompts. You aren’t just grading the final answer; you are grading the trajectory, which is the path the agent took to get there.
This lab focuses on using the Agent Development Kit (ADK) to trace and evaluate agent decisions. You will learn how to define specific evaluation criteria for your agent’s reasoning process and how to visualize the results to ensure your agent is using its tools correctly.
aside_block
<ListValue: [StructValue([(‘title’, ‘Go to lab!’), (‘body’, <wagtail.rich_text.RichText object at 0x7fc0787f3e20>), (‘btn_text’, ”), (‘href’, ”), (‘image’, None)])]>
Build and Evaluate BigQuery Agents
When an agent interacts with data, precision is paramount. A SQL-generating agent must write syntactically correct queries and retrieve accurate numbers. A hallucination here doesn’t just look bad, it might lead to bad business decisions.
In this advanced lab, you will build an agent capable of querying BigQuery and then use the GenAI Eval Service to verify the results. You will learn to measure Factual Accuracy and Completeness, ensuring your agent provides the exact data requested without omission.
aside_block
<ListValue: [StructValue([(‘title’, ‘Go to lab!’), (‘body’, <wagtail.rich_text.RichText object at 0x7fc0787f35b0>), (‘btn_text’, ”), (‘href’, ”), (‘image’, None)])]>
Trust Your AI in Production
Ready to make your AI applications production-grade? Start evaluating your model’s outputs or the trajectory taken by your agents with these codelabs:
These labs are part of the AI Evaluation module in our official Production-Ready AI with Google Cloud program. Explore the full curriculum for more content that will help you bridge the gap from a promising prototype to a production-grade AI application.
To build a production-ready agentic system, where intelligent agents can freely collaborate and act, we need standards and shared protocols for how agents talk to tools and how they talk to each other.
In the Agent Production Patterns module in the Production-Ready AI with Google Cloud Learning Path, we focus on interoperability, exploring the standard patterns for connecting agents to data, tools and each other. Here are three hands-on labs to help you build these skills.
<ListValue: [StructValue([(‘title’, ‘Start the lab!’), (‘body’, <wagtail.rich_text.RichText object at 0x7fc07046d100>), (‘btn_text’, ”), (‘href’, ”), (‘image’, None)])]>
Connecting to Data with MCP
Once you understand the basics, the next step is giving your agent access to knowledge. Whether you are analyzing massive datasets or searching operational records, the MCP Toolbox provides a standard way to connect your agent to your databases.
<ListValue: [StructValue([(‘title’, ‘Start the lab!’), (‘body’, <wagtail.rich_text.RichText object at 0x7fc07046db80>), (‘btn_text’, ”), (‘href’, ”), (‘image’, None)])]>
Expose a CloudSQL database to an MCP Client
If you need your agent to search for specific records—like flight schedules or hotel inventory—this lab demonstrates how to connect to a CloudSQL relational database.
aside_block
<ListValue: [StructValue([(‘title’, ‘Start the lab!’), (‘body’, <wagtail.rich_text.RichText object at 0x7fc07046d040>), (‘btn_text’, ”), (‘href’, ”), (‘image’, None)])]>
From Prototype to Production
By moving away from custom integrations and adopting standards like MCP and A2A, you can build agents that are easier to maintain and scale. These labs provide the practical patterns you need to connect your agents to your data, your tools, and each other.
These labs are part of the AgentProduction Patterns module in our official Production-Ready AI with Google Cloud Learning Path. Explore the full curriculum for more content that will help you bridge the gap from a promising prototype to a production-grade AI application.
Share your progress using the hashtag #ProductionReadyAI. Happy learning!
AWS Certificate Manager (ACM) now automates certificate provisioning and distribution for Kubernetes workloads through AWS Controllers for Kubernetes (ACK). Previously, ACM automated certificate management for AWS-integrated services like Application Load Balancers and CloudFront. However, using ACM certificates with applications terminating TLS in Kubernetes required manual steps: exporting certificates and private keys via API, creating Kubernetes Secrets, and updating them at renewal. This integration extends ACM’s automation to any Kubernetes workload for both public and private certificates, enabling you to manage certificates using native Kubernetes APIs.
With ACK, you define certificates as Kubernetes resources, and the ACK controller automates the complete certificate lifecycle: requesting certificates from ACM, exporting them after validation, updating Kubernetes Secrets with the certificate and private key, and automatically updating those Secrets at renewal. This enables you to use ACM exportable public certificates (launched in June 2025) for internet-facing workloads or AWS Private CA private certificates for internal services in Amazon EKS or other Kubernetes environments. Use cases include terminating TLS in application pods (NGINX, custom applications), securing service mesh communication (Istio, Linkerd), and managing certificates for third-party ingress controllers (NGINX Ingress, Traefik). You can also distribute certificates to hybrid and edge Kubernetes environments.
This feature is available in all commercial, AWS GovCloud (US), and AWS China regions where ACM is available. To learn more, visit the Git hub link or read our documentation and our pricing page.
Starting today, the general-purpose Amazon EC2 M7a instances are now available in AWS Europe (London) Region. M7a instances, powered by 4th Gen AMD EPYC processors (code-named Genoa) with a maximum frequency of 3.7 GHz, deliver up to 50% higher performance compared to M6a instances.
With this additional region, M7a instances are available in the following AWS Regions: US East (Ohio), US East (N. Virginia), US West (Oregon), Asia Pacific (Sydney, Tokyo), and Europe (Frankfurt, Ireland, Spain, Stockholm, London). These instances can be purchased as Savings Plans, Reserved, On-Demand, and Spot instances. To get started, visit the AWS Management Console, AWS Command Line Interface (CLI), and AWS SDKs. To learn more, visit the M7a instances page.
Welcome to the first Cloud CISO Perspectives for December 2025. Today, Francis deSouza, COO and president, Security Products, Google Cloud, shares our Cybersecurity Forecast report for the coming year, with additional insights from our Office of the CISO colleagues.
As with all Cloud CISO Perspectives, the contents of this newsletter are posted to the Google Cloud blog. If you’re reading this on the website and you’d like to receive the email version, you can subscribe here.
aside_block
<ListValue: [StructValue([(‘title’, ‘Get vital board insights with Google Cloud’), (‘body’, <wagtail.rich_text.RichText object at 0x7fa5b03dd1c0>), (‘btn_text’, ‘Visit the hub’), (‘href’, ‘https://cloud.google.com/solutions/security/board-of-directors?utm_source=cloud_sfdc&utm_medium=email&utm_campaign=FY24-Q2-global-PROD941-physicalevent-er-CEG_Boardroom_Summit&utm_content=-&utm_term=-‘), (‘image’, <GAEImage: GCAT-replacement-logo-A>)])]>
Forecasting 2026: The year AI rewrites the security playbook
By Francis deSouza, COO, Google Cloud
Francis deSouza, COO and president, Security Products, Google Cloud
We are at a unique point in time where we’re facing a generational refactoring of the entire technology stack, including the threat landscape. 2025 was a watershed year in cybersecurity, where AI moved to the forefront of every company’s agenda, changing the game for both security offense and defense.
While threats continue to intensify — with attackers using AI for sophisticated phishing and deepfakes — defenders also have been gaining ground. This year’s evolutions will continue to drive change in the coming year, and our annual Cybersecurity Forecast report for 2026 explores how today’s lessons will impact tomorrow’s cybersecurity across four key areas: artificial intelligence, cybercrime, nation-state threats, and regulatory obligations.
Organizations haven’t spent enough time preparing their workforces to use AI securely. It is essential that companies build a learning culture around security that includes true AI fluency.
1. The rise of agentic security automation
AI and agents will redefine how organizations secure their environment, turning the security operations center from a monitoring hub into an engine for automated action. This is critical because the window of opportunity has decreased; bad actors operate in hours, not weeks.
As data volumes explode, AI agents can give defenders a speed advantage we haven’t had in years. By stepping in to detect anomalies, automate data analysis, and initiate response workflows, your security teams can focus on the complex decisions that require human judgment. This shift won’t just improve speed — it will drive similar gains in proactively strengthening your entire security posture.
2. Building AI fluency as a defense
We will likely see a wave of AI-driven attacks targeting employees, largely because the weak link in security remains the user. Organizations haven’t spent enough time preparing their workforces to use AI securely. It is essential that companies build a learning culture around security that includes true AI fluency.
Every organization should deploy something like our Model Armor to protect their AI models. Implementing a validation layer at the gateway level ensures that guardrails are active controls rather than just theoretical guidelines.
However, technology is only half the equation. We also need a security-conscious workforce. If we don’t help our employees build these skills, teams simply won’t be equipped to identify the new wave of threats or understand how best to defend against them.
This means looking past standard training, and investing in efforts, like agentic security operations center (SOC) workshops and internal cyber war games efforts, to help educate their employees on what the threat landscape looks like in an AI world.
Read on for the key points from the Cybersecurity Forecast report, bolstered with new insights from our Office of the CISO.
AI advantages
Widespread adoption of AI agents will create new security challenges, requiring organizations to develop new methodologies and tools to effectively map their new AI ecosystems. A key part of this will be the evolution of identity and access management (IAM) to treat AI agents as distinct digital actors with their own managed identities.
AI adoption will transform security analysts’ roles, shifting them from drowning in alerts to directing AI agents in an agentic SOC. This will allow analysts to focus on strategic validation and high-level analysis, as AI handles data correlation, incident summaries, and threat intelligence drafting.
The heightened capability of agentic AI to take actions and execute tasks autonomously elevates the importance of cybersecurity basics. Organizations will need to create discrete boundary definitions for the authorization, authentication, and monitoring of each agent.
Taylor Lehmann, director, health care and life sciences
A year from now, we’re going to have an awesome security opportunity to secure a new persona in our organizations: Knowledge workers who produce truly useful, mission-critical applications and software using ideas and words — but not necessarily well-written, vetted, and tested code.
We’re going to need better and more fine-grained paths to help these new “idea-native developers” who use powerful AI tools and agents to build, test, submit, manage and blast secure code into secure production as safely and as fast as they can. In 2026 and 2027, we’re going to see how big this opportunity is. We should prepare to align our organizations, operations, and technology (OOT) to take advantage of it.
A corollary to this comes from our DORA reports: Just as AI has amplified productivity and begun optimizing work, it amplifies organizational dysfunctions — especially those that lead to inefficiently and ineffectively secured data.
Marina Kaganovich, executive trust lead
The heightened capability of agentic AI to take actions and execute tasks autonomously elevates the importance of cybersecurity basics. Organizations will need to create discrete boundary definitions for the authorization, authentication, and monitoring of each agent.
Beyond technical controls, organizational defense will depend on fostering an AI-literate workforce through training and awareness, as staff shift from performing tasks to architecting and overseeing agents. To be successful, organizations will require a fundamental shift in risk-informed culture.
Bill Reid, security advisor
Aggressive adoption of agentic AI will drive a renewed interest in threat modeling practices. Security teams will be asked to deeply understand what teams are trying to build, and will need to think about the data flows, the trust boundaries, and the guardrails needed.
Agentic AI will also demand that the supply chain be considered within that threat model, beyond the software bill of materials (SBOM), to look at how those services will control autonomous actions. It will also force a renewed look at identity and entitlements, as agents are asked to act on behalf of or as an extension of employees in the enterprise.
What may have been acceptable wide scopes covered by detective controls may no longer be sufficient, given the speed of action that comes with automation and the chaining of models together in goal seeking behavior.
Vesselin Tzvetkov, senior cybersecurity advisor
As Francis noted, agentic security operations are set to become the standard for modern SOCs, dramatically enhancing the speed and capabilities of security organizations. The agentic SOC in 2026 will feature multiple small, dedicated agents for tasks like summarization, alert grouping, similarity detection, and predictive remediation.
This shift will transform modern SOC roles and processes, moving away from tiered models in favor of CI/CD-like automation. AI capabilities and relevant know-how are essential for security personnel.
As AI drives new AI threat hunting capabilities to gain insight from data lakes in previously underexplored areas, such as OT protocols for manufacturing and industry-specific protocols like SS7 for telecommunications, the overall SOC coverage and overall industry security will improve.
Vinod D’Souza, director, manufacturing and industry
In 2026, agentic AI will help the manufacturing and industrial sector cross the critical threshold from static automation to true autonomy. Machines will self-correct and self-optimize with a speed and precision that exceeds human capacity.
The engine powering this transformation is the strategic integration of cloud-native SCADA and AI-native architectures. Security leaders should redefine their mandate from protecting a perimeter to enabling a trusted ecosystem anchored in cyber-physical identity.
Every sensor, service, autonomous agent, and digital twin should be treated as a verified entity. By rooting security strategies in data-centered Zero Trust, organizations stop treating security as a gatekeeper and transform it into the architectural foundation. More than just securing infrastructure, the goal is to secure the decision-making integrity of autonomous systems.
AI threats
We anticipate threat actors will move decisively from using AI as an exception to using it as the norm. They will use AI to enhance the speed, scope, and effectiveness of their operations, streamlining and scaling attacks.
A critical and growing threat is prompt injection, an attack that manipulates AI to bypass its security protocols and follow an attacker’s hidden command. Expect a significant rise in targeted attacks on enterprise AI systems.
Threat actors will accelerate the use of highly manipulative AI-enabled social engineering. This includes vishing (voice phishing) with AI-driven voice cloning to create hyperrealistic impersonations of executives or IT staff, making attacks harder to detect and defend against.
The increasing complexity of hybrid and multicloud architectures, coupled with the rapid, ungoverned introduction of AI agents, will accelerate the crisis in IAM failures, cementing them as the primary initial access vector for significant enterprise compromise.
Anton Chuvakin, security advisor
We’ve been hearing about the sizzle of AI for some time, but now we need the steak to be served. While there’s still a place for exciting, hypothetical use cases, we need tangible AI benefits backed by solid security data of value and benefits obtained and proven.
Whether your company adopts agents or not, your employees will use them for work. Shadow agents raise new and interesting risks, especially when your employees connect their personal agents to corporate systems. Organizations will have to invest to mitigate the risks of shadow agents — merely blocking them simply won’t work (they will sneak back in immediately).
David Stone, director, financial services
As highlighted in the Google Threat Intelligence Group report on adversarial use of AI, attackers will use gen AI to exploit bad hygiene, employ deepfake capabilities to erode trust in processes, and discover zero-day vulnerabilities. Cyber defenders will likewise have to adopt gen AI capabilities to find and fix cyber hygiene, patch code at scale, and scrutinize critical business processes to get signals to find and stop exploitation of humans in the process.
Security will continue to grow in importance in the boardroom as the key focus on resilience, business enablement, and business continuity — especially as AI-driven attacks evolve.
Jorge Blanco, director, Iberia and Latin America
The increasing complexity of hybrid and multicloud architectures, coupled with the rapid, ungoverned introduction of AI agents, will accelerate the crisis in IAM failures, cementing them as the primary initial access vector for significant enterprise compromise.
The proliferation of sophisticated, autonomous agents — often deployed by employees without corporate approval (the shadow agent risk) — will create invisible, uncontrolled pipelines for sensitive data, leading to data leaks and compliance violations. The defense against this requires the evolution of IAM to agentic identity management, treating AI agents as distinct digital actors with their own managed identities.
Organizations that fail to adopt this dynamic, granular control — focusing on least privilege, just-in-time access, and robust delegation — will be unable to minimize the potential for privilege creep and unauthorized actions by these new digital actors. The need for practical guidance on securing multicloud environments, including streamlined IAM configuration, will be acutely felt as security teams grapple with this evolving threat landscape.
Sri Gourisetti, senior cybersecurity advisor
The increased adversarial use of AI for the development of malware modules may likely result in “malware bloat” — a high volume of AI-generated malicious code that is non-functional or poorly optimized, creating significant noise for amateur adversaries and defenders.
Functional malware will become more modular and mature, designed to be compatible and interact with factory floor and OT environments as the manufacturing and industrial sector moves beyond initial exploration of generative AI toward the structural deployment of agentic AI in IT, OT, and manufacturing workflows.
Widya Junus, strategy operations
Over 70% of cloud breaches stem from compromised identities, according to a recent Cloud Threat Horizons report, and we expect that trend to accelerate as threat actors exploit AI. The security focus should shift from human-centered authentication to automated governance of non-human identities using Cloud Infrastructure Entitlement Management (CIEM) and Workload Identity Federation (WIF).
Accordingly, as AI-assisted attacks lower the barrier for entry and cloud-native ransomware specifically targets APIs to encrypt workloads, organizations will increasingly rely on tamper-proof backups (such as Backup Vault) and AI-driven automated recovery workflows to ensure business continuity — rather than relying solely on perimeter defenses to stop every attack.
Cybercrime
The combination of ransomware, data theft, and multifaceted extortion will remain the most financially disruptive category of cybercrime. The volume of activity is escalating, with focus on targeting third-party providers and exploiting zero-day vulnerabilities for high-volume data exfiltration.
As the financial sector increasingly adopts cryptocurrencies, threat actors are expected to migrate core components of their operations onto public blockchains for unprecedented resilience against traditional takedown efforts.
As security controls mature in guest operating systems, adversaries are pivoting to the underlying virtualization infrastructure, which is becoming a critical blind spot. A single compromise here can grant control over the entire digital estate and render hundreds of systems inoperable in a matter of hours.
Next year, we’ll see the first sustained, automated campaigns where threat actors use agentic AI to autonomously discover and exploit vulnerabilities faster than human defenders can patch exploited vulnerabilities.
David Homovich, advocacy lead
In 2026, we expect to see more boards pressuring CISOs to translate security exposure and investment into financial terms, focusing on metrics like potential dollar losses and the actual return on security investment. Crucially, operational resilience — the organization’s ability to quickly recover from an AI-fueled attack — is a non-negotiable board expectation.
CISOs take note: Boards are asking us about business resilience and the impact of advanced, machine-speed attacks — like adversarial AI and securing autonomous identities such as AI agents. Have your dollar figures ready, because this is the new language of defense for boards.
Crystal Lister, security advisor
Next year, we’ll see the first sustained, automated campaigns where threat actors use agentic AI to autonomously discover and exploit vulnerabilities faster than human defenders can patch exploited vulnerabilities.
2025 showed us that adversaries are no longer leveraging artificial intelligence just for productivity gains, they are deploying novel AI-enabled malware in active operations. The ShadowV2 botnet was likely a test run for autonomous C2 infrastructure.
Furthermore, the November 2025 revelations about Chinese state-sponsored actors using Anthropic’s Claude to automate espionage code-writing demonstrates that barriers to entry for sophisticated attacks have collapsed. Our security value proposition should shift from detection to AI-speed preemption.
The global stage: Threat actors
Cyber operations in Russia are expected to undergo a strategic shift, prioritizing long-term global strategic goals and the development of advanced cyber capabilities over just tactical support for the conflict in Ukraine.
The volume of China-nexus cyber operations is expected to continue surpassing that of other nations. They will prioritize stealthy operations, aggressively targeting edge devices and exploiting zero-day vulnerabilities.
Driven by regional conflicts and the goal of regime stability, Iranian cyber activity will remain resilient, multifaceted, and semi-deniable, deliberately blurring the lines between espionage, disruption, and hacktivism.
North Korea will continue to conduct financial operations to generate revenue for the regime, cyber espionage against perceived adversaries, and seek to expand IT worker operations.
Sovereign cloud will become a drumbeat across most of Europe, as EU member states seek to decrease their reliance on American tech companies.
Bob Mechler, director, Telco, Media, Entertainment and Gaming
The telecom cybersecurity landscape in 2026 will be dominated by the escalation of AI-driven attacks and persistent geopolitical instability. We may witness the first major AI-driven cybersecurity breach, as adversaries use AI to automate exploit development and craft sophisticated attacks that outpace traditional defenses.
This technological escalation coincides with a baseline of state-backed and politically-motivated cyber-threat activity, where critical infrastructure is targeted as part of broader geopolitical conflicts. Recent state-sponsored campaigns, such as Salt Typhoon, highlight how adversaries are already penetrating telecommunications networks to establish long-term access, posing a systemic threat to national security.
Toby Scales, security advisor
Sovereign cloud will become a drumbeat across most of Europe, as EU member states seek to decrease their reliance on American tech companies.
At the same time, the AI capability gap will continue to widen and both enterprises and governments will chase agreements with frontier model providers. Regulatory bodies may seek to enforce “locally hosted fine-tuned models” as a way to protect state secrets, but will face predictable opposition from frontier model developers.
Meeting regulatory obligations
Governance has taken on new importance in the AI era. Key areas of focus are expanding to include data integrity to prevent poisoning attacks, model security to defend against evasion and theft, and governance fundamentals to ensure transparency and accountability.
CISOs and governance, risk, and compliance teams should work together to build an AI resilience architecture, establish continuous AI health monitoring, integrate AI into business continuity and incident response, and embed AI resilience into security governance.
Bhavana Bhinder, security, privacy, and compliance advisor
In 2026, we will see the validated AI operating model become the industry standard for healthcare and life sciences (HCLS), with a shift from pilot projects to organizations seeking full-scale production deployments that are compliant and audit-ready by design. The logical evolution for HCLS will move towards agentic evaluation, where autonomous agents act as real-time auditors.
Instead of periodic reviews, these agents will continuously validate that generative AI outputs (such as clinical study reports) remain factually grounded and conform to regulatory standards. Organizations using governed, quality-scored data necessary to trust advanced models like Gemini across the drug lifecycle, clinical settings, and quality management will depend on AI workflows that natively support industry- and domain-specific regulations.
Odun Fadahunsi, senior security risk and compliance advisor
As regulators and sectoral bodies in finance, healthcare and critical infrastructure define AI-specific resilience obligations, CISOs must treat AI resilience as a primary pillar of security, not a separate or optional discipline. AI systems are poised to become so deeply embedded in identity, fraud detection, customer operations, cloud automation, and decisioning workflows that AI availability and reliability will directly determine an organization’s operational resilience.
Unlike traditional systems, AI can fail in silent, emergent, or probabilistic ways — drifting over time, degrading under adversarial prompt, and behaving unpredictably after upstream changes in data or model weights. These failure modes will create security blindspots, enabling attackers to exploit model weaknesses that bypass traditional controls.
CISOs and governance, risk, and compliance teams should work together to build an AI resilience architecture, establish continuous AI health monitoring, integrate AI into business continuity and incident response, and embed AI resilience into security governance.
For more leadership guidance from Google Cloud experts, please see ourCISO Insights hub.
Here are the latest updates, products, services, and resources from our security teams so far this month:
Responding to React2Shell (CVE-2025-55182): Follow these recommendations to minimize remote code execution risks in React and Next.js from the React2Shell (CVE-2025-55182) vulnerability. Read more.
How Google Does It: Securing production services, servers, and workloads: Here are the three core pillars that define how we protect production workloads at Google-scale. Read more.
How Google Does It: Using Binary Authorization to boost supply chain security: “Don’t trust, verify,” guides how we secure our entire software supply chain. Here’s how we use Binary Authorization to ensure that every component meets our security best practices and standards. Read more.
New data on ROI of AI in security: Our new ROI of AI in security report showcases how organizations are getting value from AI in cybersecurity, and finds a significant, practical shift is underway. Read more.
Using MCP with Web3: How to secure blockchain-interacting agents: In the Web3 world, who hosts AI agents, and who holds the private key to operations, are pressing questions. Here’s how to get started with the two most likely agent models. Read more.
Expanding the Google Unified Security Recommended program: We are excited to announce Palo Alto Networks as the latest addition to the Google Unified Security Recommended program, joining previously announced partners CrowdStike, Fortinet and Wiz. Read more.
Why PQC is Google’s path forward (and not QKD): After closely evaluating Quantum Key Distribution (QKD), here’s why we chose post-quantum cryptography (PQC) as the more scalable solution for our needs. Read more.
Architecting security for agentic capabilities in Chrome: Following the recent launch of Gemini in Chrome and the preview of agentic capabilities, here’s our approach and some new innovations to improve the safety of agentic browsing. Read more.
Android Quick Share support for AirDrop: As part of our efforts to continue to make cross-platform communication easier, we’ve made Quick Share interoperable with AirDrop, allowing for two-way file sharing between Android and iOS devices, starting with the Pixel 10 Family. Read more.
Please visit the Google Cloud blog for more security stories published this month.
aside_block
<ListValue: [StructValue([(‘title’, ‘Join the Google Cloud CISO Community’), (‘body’, <wagtail.rich_text.RichText object at 0x7fa5b03dd430>), (‘btn_text’, ‘Learn more’), (‘href’, ‘https://rsvp.withgoogle.com/events/ciso-community-interest?utm_source=cgc-blog&utm_medium=blog&utm_campaign=2024-cloud-ciso-newsletter-events-ref&utm_content=-&utm_term=-‘), (‘image’, <GAEImage: GCAT-replacement-logo-A>)])]>
Threat Intelligence news
Intellexa’s prolific zero-day exploits continue: Despite extensive scrutiny and public reporting, commercial surveillance vendors such as Intellexa continue to operate unimpeded. Known for its “Predator” spyware, new GTIG analysis shows that Intellexa is evading restrictions and thriving. Read more.
APT24’s pivot to multi-vector attacks: GTIG is tracking a long-running and adaptive cyber espionage campaign by APT24, a People’s Republic of China (PRC)-nexus threat actor that has been deploying BADAUDIO over the past three years. Here’s our analysis of the malware, and how defenders can detect and mitigate this persistent threat. Read more.
Get going with Time Travel Debugging using a .NET process hollowing case study: Unlike traditional live debugging, this technique captures a deterministic, shareable record of a program’s execution. Here’s how to start incorporating TTD into your analysis. Read more.
Analysis of UNC1549 targeting the aerospace and defense ecosystem: Following last year’s post on suspected Iran-nexus espionage activity targeting the aerospace, aviation, and defense industries in the Middle East, we discuss additional tactics, techniques, and procedures (TTPs) observed in incidents Mandiant has responded to. Read more.
Please visit the Google Cloud blog for more threat intelligence stories published this month.
Now hear this: Podcasts from Google Cloud
The truth about autonomous AI hacking: Heather Adkins, Google’s Security Engineering vice-president, separates the hype from the hazards of autonomous AI hacking, with hosts Anton Chuvakin and Tim Peacock. Listen here.
Escaping 1990s vulnerability management: Caleb Hoch, consulting manager for security transformations, Mandiant, discusses with Anton and Tim how vulnerability management has evolved beyond basic scanning and reporting, and the biggest gaps between modern practices and what organizations are actually doing. Listen here.
The art and craft of cloud bug hunting: Bug bounty professionals Sivanesh Ashok and Sreeram KL, have won the Most Valuable Hacker award from the Google Cloud VRP team. They chat about all things buggy with Anton and Tim, including how to write excellent bug bounty reports. Listen here.
Behind the Binary: The art of deconstructing problems: Host Josh Stroschein is joined by Nino Isakovic, a long-time low-level security expert, for a thought-provoking conversation that spans the foundational and the cutting-edge — including his discovery of the ScatterBrain obfuscating compiler. Listen here.
To have our Cloud CISO Perspectives post delivered twice a month to your inbox, sign up for our newsletter. We’ll be back in a few weeks with more security-related updates from Google Cloud.
We can all agree that the quality of AI-driven answers relies on the consistency of the underlying data. But AI models, while powerful, lack business context out of the box. As more organizations ask questions of their data using natural language, it is increasingly important to unify business measures and dimensions, ensure consistency company-wide. If you want trustworthy AI, what you need is a semantic layer that acts as the single source of truth for business metrics.But how do you make that data accessible and actionable for your end users? Building off the recent introduction of Looker’s Model Context Protocol (MCP) server, in this blog we take you through the process of creating an Agent Development Kit (ADK) agent that is connected to Looker via the MCP Toolbox for Databases and exposing it within Gemini Enterprise. Let’s get started.Step 1 – Set up Looker Integration in MCP Toolbox
MCP Toolbox for Databases is a central open-source server that hosts and manages toolsets, enabling agentic applications to leverage Looker’s capabilities without working directly with the platform. Instead of managing tool logic and authentication themselves, agents act as MCP clients and request tools from the Toolbox. The MCP Toolbox handles all the underlying complexities, including secure connections to Looker, authentication and query execution.
The MCP Toolbox for Databases natively supports Looker’s pre-built toolset. To access these tools, follow the below steps:
Connect to Cloud Shell. Check that you’re already authenticated, and that the project is set to your project ID using the following command:
Install the binary version of the MCP Toolbox for Databases via the script given below. This command is for Linux; if you run on Macintosh or Windows, ensure that you download the correct binary. Check out the releases page for your Operation System and Architecture and download the correct binary.
code_block
<ListValue: [StructValue([(‘code’, ‘export OS=”linux/amd64″ # one of linux/amd64, darwin/arm64, darwin/amd64, or windows/amd64rncurl -O https://storage.googleapis.com/genai-toolbox/v0.12.0/$OS/toolboxrnchmod +x toolbox’), (‘language’, ”), (‘caption’, <wagtail.rich_text.RichText object at 0x7fa5baae0a30>)])]>
Deploy Toolbox to Cloud Run
Next, you’ll need to run MCP Toolbox. The simplest way to do that is on Cloud Run, Google Cloud’s fully managed container application platform. Here’s how:
The Cloud Run will ask if you want Unauthenticated, select No.Allow Unauthenticated: N
Step 2: Deploy ADK Agent to Agent Engine
Next, you need to configure Agent Development Kit (ADK), a flexible and modular framework for developing and deploying AI agents. ADK was designed to make agent development feel more like software development, to make it easier for developers to create, deploy, and orchestrate agentic architectures that range from simple tasks to complex workflows. And while ADK is optimized for Gemini and the Google ecosystem, it’s also model-agnostic, deployment-agnostic, and is built for compatibility with other frameworks.
Vertex AI Agent Engine, a part of the Vertex AI Platform, is a set of services that enables developers to deploy, manage, and scale AI agents in production. Agent Engine handles the infrastructure to scale agents in production so you can focus on creating applications.
Open a new terminal tab in Cloud Shell and create a folder named my-agents as follows. You also need to navigate to the my-agents folder.
Now you’re ready to use adk to create a scaffolding, including folders, environment and basic files, for our Looker Agent Application via the adkcreate command with an app name looker_app:
Gemini model for choosing a model for the root agent
Vertex AI for the backend
Your default Google Project Id and region
code_block
<ListValue: [StructValue([(‘code’, ‘Choose a model for the root agent:rn1. gemini-2.5-flash-001rn2. Other models (fill later)rnChoose model (1, 2): 1rnrnrn1. Google AIrn2. Vertex AIrnChoose a backend (1, 2): 2rnrnEnter Google Cloud project ID [your_current_project_id]:rnEnter Google Cloud region [us-central1]:rnrnAgent created in /home/romin/looker-app:rn- .envrn- __init__.pyrn- agent.py’), (‘language’, ”), (‘caption’, <wagtail.rich_text.RichText object at 0x7fa5bd2720a0>)])]>
Observe the folder in which a default template and required files for the Agent have been created.
First up is the .env file:
code_block
<ListValue: [StructValue([(‘code’, ‘GOOGLE_GENAI_USE_VERTEXAI=1rnGOOGLE_CLOUD_PROJECT=YOUR_GOOGLE_PROJECT_IDrnGOOGLE_CLOUD_LOCATION=YOUR_GOOGLE_PROJECT_REGION’), (‘language’, ”), (‘caption’, <wagtail.rich_text.RichText object at 0x7fa5bd272220>)])]>
The values indicate that you will be using Gemini via Vertex AI along with the respective values for the Google Cloud Project Id and location.
Then you have the __init__.py file that marks the folder as a module and has a single statement that imports the agent from the agent.py file:
Finally, take a look at the agent.py file. The contents can be edited to similar to the example below:
Insert the Cloud Run URL highlighted here (. not the one with the project number in the url).
code_block
<ListValue: [StructValue([(‘code’, ‘import osrnfrom google.adk.agents import LlmAgentrnfrom google.adk.planners.built_in_planner import BuiltInPlannerrnfrom google.adk.tools.mcp_tool.mcp_toolset import MCPToolsetrnfrom google.adk.tools.mcp_tool.mcp_session_manager import SseConnectionParams, StreamableHTTPConnectionParamsrnfrom google.genai.types import ThinkingConfigrnfrom google.auth import compute_enginernimport google.auth.transport.requestsrnimport google.oauth2.id_tokenrnrn# Replace this URL with the correct endpoint for your MCP server.rnMCP_SERVER_URL = “YOUR_CLOUD_RUN_URL/mcp”rnif not MCP_SERVER_URL:rn raise ValueError(“The MCP_SERVER_URL is not set.”)rndef get_id_token():rn “””Get an ID token to authenticate with the MCP server.”””rn target_url = MCP_SERVER_URLrn audience = target_url.split(‘/mcp’)[0]rn auth_req = google.auth.transport.requests.Request()rn id_token = google.oauth2.id_token.fetch_id_token(auth_req, audience)rn # Get the ID token.rn return id_tokenrnrnrnroot_agent = LlmAgent(rn model=’gemini-2.5-flash’,rn name=’looker_agent’,rn description=’Agent to answer questions about Looker data.’,rn instruction=(rn ‘You are a helpful agent who can answer user questions about Looker data the user has access to. Use the tools to answer the question. If you are unsure on what model to use, try defaulting to thelook and if you are also unsure on the explore, try order_items if using thelook model’rn ),rnplanner=BuiltInPlanner(rnthinking_config=ThinkingConfig(include_thoughts=False, thinking_budget=0)rn),rntools=[rnMCPToolset(rnconnection_params=StreamableHTTPConnectionParams(rnurl=MCP_SERVER_URL,rnheaders={rn”Authorization”: f”Bearer {get_id_token()}”,rn}rn),rnerrlog=None,rn# Load all tools from the MCP server at the given URLrntool_filter=None,rn)rn],rn)’), (‘language’, ”), (‘caption’, <wagtail.rich_text.RichText object at 0x7fa5bd272940>)])]>
NOTE: Ensure you grant the Cloud Run Invoker role to the default Agent Engine Service Account (i.e., service-PROJECT_NUMBER@gcp-sa-aiplatform-re.iam.gserviceaccount.com)
Step 3: Connect to Gemini Enterprise
Now it’s time to create a Gemini Enterprise app (instructions here).
Run the below command with the GCP Project Number, Reasoning Engine resource name output from the ‘deploy agent_engine’ command above, and your Gemini Enterprise Agent ID from the Gemini Enterprise Apps interface:
Your Looker data will now be available within your Gemini Enterprise app.If you don’t have access to this feature, contact your Google Cloud account team.
Querying business data made easier
Connecting Looker’s semantic layer to Vertex AI Agent services by way of the ADK and MCP Toolbox is a big win for data accessibility. By exposing your trusted Looker models and Explores in Gemini Enterprise, you empower end-users to query complex business data using natural language. This integration closes the gap between data insights and immediate action, ensuring that your organization’s semantic layer is not just a source of passive reports, but an active, conversational, and decision-driving asset.
Today, many organizations operate with data that’s trapped in silos, in disconnected legacy systems and is days or hours old. However, the rise of AI presents the need and opportunity to unify these environments, tap into unstructured data from audio, video, and text files, which together, makes up more than 80% of enterprise data and enable business decisions informed by real-time data. Data teams navigating AI also face a new set of challenges such as automating complex workflows and apps, grounding them in enterprise data, activating real-time insights on multimodal data, and building a foundation that inspires trust in AI.
Google’s Data Cloud is an AI-native platform designed to unify an organization’s entire data foundation and enable intelligent applications and agentic experiences. Data Cloud integrates Google infrastructure, intelligence, and data platform with pioneering AI advancements, including Gemini for working with data, automation of metadata management and governance, and flexible workflows for developers, allowing customers to focus on innovation and business outcomes rather than integration challenges.
Recently, we were honored to be recognized as a Leader in the 2025 Gartner® Magic Quadrant™ for Data Integration Tools. In our opinion this demonstrates Data Cloud’s tight integration with data integration tools and vision for AI, including customer use cases for multimodal data processing, and scalable, efficient vectorization. In addition, we were recognized as a leader in the Forrester Wave™ :Streaming Data Platforms, Q4 2025. In this blog post, we take a look at recent updates and innovations that we believe made recognition from these two leading analyst firms possible.
Boost productivity with Gemini-powered intelligence
Data agents are revolutionizing the way different data roles operate by bringing automation, intelligence, and natural language capabilities into their daily workflows. Whether you’re a data analyst querying and visualizing data more efficiently, a developer building smarter applications, or a data scientist accelerating model development, agents can help streamline repetitive tasks and boost your productivity. Data engineers benefit from automated data preparation and pipeline management, while ML engineers can deploy and monitor models more effectively. Even business users, who traditionally rely on technical teams for insights, can now interact with data directly using natural language.
Recent innovations to Gemini with BigQuery for data engineering provide automation to build data pipelines to ingest, transform, and validate data. This includes data transformations like data cleaning, deduplication, formatting, standardizing, joins, and aggregations as well as data quality to enforce rules and standards. Building on these capabilities, the Data Engineering Agent further accelerates productivity by intelligently automating these standard integration patterns and proactively monitoring pipeline health.
Speed efficiency with multimodal automation and governance
We are removing the friction to build AI applications using autonomous vector embedding for multimodal data. Building on our BigQuery Vector Search capabilities, data teams can build, manage, and maintain complex data pipelines without needing to update vector embeddings. BigQuery now takes care of this automatically with added capabilities for agents to connect user intent to enterprise data. This is powering customer systems like the in-store product finder at Morrisons, which handles 50,000 customer searches on a busy day.
We are also helping organizations ensure their data platform acts as a real-time brain for AI, including orchestration and AI-infused services. Governance is foundational to data and AI success. In today’s world of distributed data spanning lakes, warehouses, and operational systems, intelligence is impossible without unified governance.
New automated cataloging with Dataplex Universal Catalog allows data teams to discover, ingest, and index metadata from a wide range of sources, minimizing the effort involved in cataloging data, and providing a near-real-time view of your data and AI landscape. Dataplex provides context to your data teams and your agents beyond the normal scope of a universal catalog. It leverages Gemini to continuously derive relationships and auto-generate business semantics, providing AI agents with trusted, real-time context.
Ericsson uses Dataplex to deliver a unified business vocabulary to users, including data classification, ownership, retention policies, and sensitivity labels. This allows different data personas to instantly understand a data origin, increasing trust and reducing investigation time.
Optimize workloads for broad usability
Managing data across cloud and hybrid environments can be piecemeal, leading to costly inefficiencies, redundant storage, and complex data movement.
To help, visual pipelines provide a code-free user experience for designing, deploying, managing and monitoring pipelines, with a metadata-driven approach to improving developer productivity. And enhancements to data preparation in BigQuery provide a single platform to clean, structure, enrich and build data pipelines.
For ML transformations supporting retrieval augmented generation (RAG) use cases, recent innovations enhance model inference to ML models in real-time or batch. And support for libraries and frameworks for multimodal data allows data teams to leverage multiple models in a single pipeline, improving accuracy and recall.
Integrating real-time data and context for AI
Agents need context in order to be effective and are significantly limited when they rely on static or outdated information. To make accurate decisions that genuinely help users and the business, they need real-time access to the current state of your systems and users. We launched Managed Service for Apache Kafka last year to help you integrate your operational and transactional data into your AI and data platform that in turn can then power your AI agents. This year, we added critical enterprise capabilities such as Apache Kafka Connect, VPC Service Controls, mutual TLS authentication, and Kafka access control which have helped customers like MadHive deploy to production in a matter of months. To enable new streaming architectures, we added User-Defined Functions support (UDFs) in Pub/Sub for transforming messages (like JSON) before they go to destinations like BigQuery, allowing custom logic, validation, and enrichment on the streaming data and making Pub/Sub pipelines more powerful and flexible. We also enhanced Dataflow, the advanced unified streaming and batch processing engine with critical capabilities such as parallel updates, Managed I/O, Google Cloud TPU support, speculative execution and more to bring the power of AI enabled data processing to advanced stream processing use cases such as continuous ML feature extraction and real time fraud detection.
Data integration and streaming momentum
It was a busy year for the Google Data Cloud team, and we are honored to be recognized in these recent Gartner and Forrester reports. We look forward to continuing to innovate and partner with you on your data transformation journey.
Forrester does not endorse any company, product, brand, or service included in its research publications and does not advise any person to select the products or services of any company or brand based on the ratings included in such publications. Information is based on the best available resources. Opinions reflect judgment at the time and are subject to change. For more information, read about Forrester’s objectivityhere .
Gartner, Magic Quadrant for Data Integration Tools, Michele Launi, Nina Showell, Robert Thanaraj, Sharat Menon, 8 December 2025
Gartner does not endorse any vendor, product or service depicted in its research publications and does not advise technology users to select only those vendors with the highest ratings or other designation. Gartner research publications consist of the opinions of Gartner’s Research & Advisory organization and should not be construed as statements of fact. Gartner disclaims all warranties, expressed or implied, with respect to this research, including any warranties of merchantability or fitness for a particular purpose.
GARTNER is a registered trademark and service mark of Gartner, Inc. and/or its affiliates in the U.S. and internationally, and MAGIC QUADRANT is a registered trademark of Gartner, Inc. and/or its affiliates and are used herein with permission. All rights reserved.
Pioneering organizations have been using Gemini Live API to build the next generation of multimodal conversational AI that blends voice, vision, and text, to deliver fluid, human-like, and highly contextual interactions. For Google Cloud customers, this means you can deploy low-latency voice and video agents with the stability and performance required for your most demanding workflows.
A new standard with real-time multimodal AI agents
Gemini Live API represents a new standard for bringing AI to life. Imagine an agent that doesn’t just listen, but instantly understands the user’s intent, the context of their screen, captures the emotion in their voice, and responds with a human-like voice — all in real time.
The power behind this dynamic capability is the Gemini 2.5 Flash Native Audio model. Our approach is based on a simple commitment: to bring the same high-quality conversational intelligence found in advanced experiences across Google directly to your enterprise applications.
In a real-time interaction, precision and speed are non-negotiable. Gemini Live API is natively multimodal and is designed to handle the instantaneous complexity of human dialogue:
It can process interruptions mid-sentence without missing a beat, ensuring natural turn-taking.
It understands acoustic cues like pitch and pace, deciphering intent and tone.
It can see and discuss complex visual data (charts, live video, diagrams) shared by a user, providing immediate, contextual assistance.
The confidence to deploy on Vertex AI
Gemini Live API is engineered for enterprise success. Vertex AI provides the security and stability your mission-critical agents need for production.
The Gemini 2.5 Flash Native Audio model is optimized to process a high volume of concurrent interactions with consistent, low-latency performance. Deploying on Vertex AI allows you to leverage our expanding global infrastructure across multiple regions, delivering reliability for your users. Additionally, enterprise-grade data residency features that allow you to manage where your data is processed, helping you meet critical regulatory and compliance standards.
Building real-world impact with Gemini Live API
The true power of Gemini Live API is demonstrated by the companies who are using it today to redefine their customer experiences.
Shopify, the leading global commerce platform, developed Sidekick, a multimodal AI assistant powered by Gemini Live API on Vertex AI. It provides personalized, robust support away from a desk, enabling real-time problem solving that eliminates traditional ticketing workflows.
“Users often forget they’re talking to AI within a minute of using Sidekick, and in some cases have thanked the bot after a long chat. This is an exciting time to be an entrepreneur. New AI capabilities offered through Gemini empower our merchants to win.” – David Wurtz, VP of Product, Shopify
United Wholesale Mortgage (UWM) transformed its business process by using their AI Loan Officer Assistant, Mia, to dramatically increase business efficiency for their broker partners.
“By integrating the Gemini 2.5 Flash Native Audio model and harnessing the Gemini Live API capabilities on the Vertex AI platform, we’ve significantly enhanced Mia’s capabilities since launching in May 2025. This powerful combination has enabled us to generate over 14,000 loans for our broker partners, proving that AI is much more than just a buzzword at UWM.” – Jason Bressler, Chief Technology Officer, UWM
SightCall provides remote video support and AI-driven visual assistance, helping customer service and field teams solve problems faster.
“What makes this partnership so exciting is that the Gemini 2.5 Flash Native Audio model isn’t just fast — it’s seamlessly human. When combined with SightCall Xpert Knowledge™, it becomes a real-time expert that knows what your best technicians know… This is the future of visual support.” – Thomas Cottereau, CEO, SightCall
Napster uses the Gemini Live API’s vision and audio capabilities so their users can co-create and receive live guidance from specialized AI companions.
“By utilizing the Gemini 2.5 Flash Native Audio model on Vertex AI, we’ve built something we couldn’t before: AI Companions that see you, see your screen, and respond like real experts in real-time conversation. This combination of vision and audio enables genuine collaboration — no prompting, no engineering — just natural dialogue where AI understands your full context and unlocks creativity and expertise for everyone.” – Edo Segal, CTO, Napster
Lumeris is deploying their health AI assistant, Tom, in high-stakes environments where nuance and emotional sensitivity are non-negotiable.
“The transition to the Gemini Live API on Vertex AI is a strategic investment in more intuitive and efficient patient conversations. The result is a more responsive and personalized voice experience. For Lumeris, our goal is elevating the quality of every interaction between patients and Tom, our agentic primary care team member. This helps us set a new standard for patient care.” – Jean-Claude Saghbini, President and Chief Technology Officer, Lumeris
Newo deploys versatile AI Receptionists that achieve a conversational quality that is truly lifelike and emotionally intuitive, handling tasks from general inquiries to sales.
“Working with the Gemini 2.5 Flash Native Audio model through Vertex AI allows Newo.ai AI Receptionists to achieve unmatched conversational intelligence — combining ultra-low latency with advanced reasoning. They can identify the main speaker even in noisy settings, switch languages mid-conversation, and sound remarkably natural and emotionally expressive. Our Gemini Live API-powered outbound AI Sales Agents can laugh, joke, and truly connect — making every call feel human.” – David Yang, co-founder, Newo.ai
11Sight is redefining customer interactions with AI-powered conversational agents that book appointments and close sales.
“The Gemini 2.5 Flash Native Audio model on Vertex AI gave us the enterprise-grade platform required to rapidly develop our voice AI agents with very low latency. Integrating this solution with our Sentinel AI Agents pushed our call resolution rates from 40% in February to 60% in November.” – Dr. Farokh Eskafi, CTO, 11Sight
Give your AI apps and agents a natural, almost human-like interface, all through a single WebSocket connection.
Today, we announced the general availability of Gemini Live API on Vertex AI, which is powered by the latest Gemini 2.5 Flash Native Audio model. This is more than just a model upgrade; it represents a fundamental move away from rigid, multi-stage voice systems towards a single, real-time, emotionally aware, and multimodal conversational architecture.
We’re thrilled to give developers a deep dive into what this means for building the next generation of multimodal AI applications. In this post we’ll look at two templates and three reference demos that help you understand how to best use Gemini Live API.
Gemini Live API as your new voice foundation
For years, building conversational AI involved stitching together a high-latency pipeline of Speech-to-Text (STT), a Large Language Model (LLM), and Text-to-Speech (TTS). This sequential process created the awkward, turn-taking delays that prevented conversations from ever feeling natural.
Gemini Live API fundamentally changes the engineering approach with a unified, low-latency, native audio architecture.
Native audio processing: Gemini 2.5 Flash Native Audio model processes raw audio natively through a single, low-latency model. This unification is the core technical innovation that dramatically reduces latency.
Real-time multimodality: The API is designed for unified processing across audio, text, and visual modalities. Your agent can converse about topics informed by live streams of visual data (like charts or live video feeds shared by a user) simultaneously with spoken input.
Next-generation conversation features
Gemini Live API gives you a suite of production-ready features that define a new standard for AI agents:
Affective dialogue (emotional intelligence): By natively processing raw audio, the model can interpret subtle acoustic nuances like tone, emotion, and pace. This allows the agent to automatically de-escalate stressful support calls or adopt an appropriately empathetic tone.
Proactive audio (smarter barge-in): This feature moves beyond simple Voice Activity Detection (VAD). As demonstrated in our live demo, you can configure the agent to intelligently decide when to respond and when to remain a silent co-listener. This prevents unnecessary interruptions when passive listening is required, making the interaction feel truly natural.
Tool use: Developers can seamlessly integrate tools like Function Calling and Grounding with Google Search into these real-time conversations, allowing agents to pull real-time world knowledge and execute complex actions immediately based on spoken and visual input.
Continuous memory: Agents maintain long, continuous context across all modalities.
Enterprise-grade stability: With GA release, you get the high availability required for production workloads, including multi-region support to ensure your agents remain responsive and reliable for users globally.
Developer quickstart: Getting started
For developers, the quickest way to experience the power of low-latency, real-time audio is to understand the flow of data. Unlike REST APIs where you make a request and wait, Gemini Live API requires managing a bi-directional stream.
Gemini Live API flow
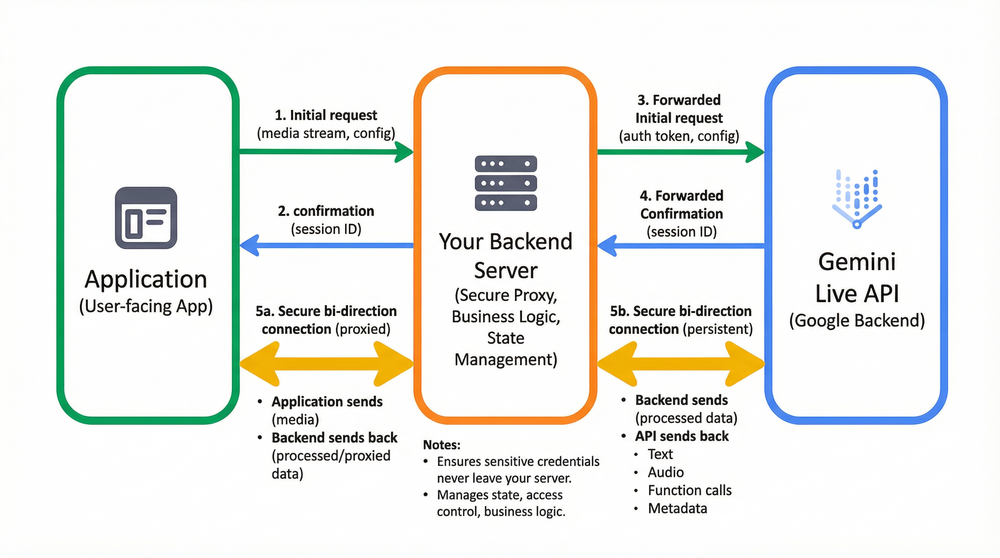
Before diving into code, it is critical to visualize the production architecture. While a direct connection is possible for prototyping, most enterprise applications require a secure, proxied flow: User-facing App -> Your Backend Server -> Gemini Live API (Google Backend).
In this architecture, your frontend captures media (microphone/camera) and streams it to your secure backend, which then manages the persistent WebSocket connection to Gemini Live API in Vertex AI. This ensures sensitive credentials never leave your server and allows you to inject business logic, persist conversation state, or manage access control before data flows to Google.
To help you get started, we have released two distinct Quickstart templates – one for understanding the raw protocol, and one for modern component-based development.
Core implementation: You interact with the gemini-live-2.5-flash-native-audio model via a stateful WebSocket connection.
code_block
<ListValue: [StructValue([(‘code’, “const client = new GeminiLiveAPI(proxyUrl, projectId, model);rnrn// Connect using the access token handled by the proxyrnclient.connect(accessToken); rnrn// Stream audio from the user’s microphonernclient.sendAudioMessage(base64AudioChunk);”), (‘language’, ”), (‘caption’, <wagtail.rich_text.RichText object at 0x7fa5b0254df0>)])]>
Running the Vanilla JS Demo:
code_block
<ListValue: [StructValue([(‘code’, ‘pip3 install -r requirements.txtrngcloud auth application-default loginrnpython3 server.pyrn# Open http://localhost:8000’), (‘language’, ”), (‘caption’, <wagtail.rich_text.RichText object at 0x7fa5b0254730>)])]>
Pro-tip: Debugging raw audio Working with raw PCM audio streams can be tricky. If you need to verify your audio chunks or test Base64 strings, we’ve included a PCM Audio Debugger in the repository.
Best for: Building scalable, production-ready applications with complex UIs.
If you are building a robust enterprise application, our React starter provides a modular architecture using AudioWorklets for high-performance, low-latency audio processing.
Features:
Real-time streaming: Audio and video streaming to Gemini with React state management.
AudioWorklets: Uses capture.worklet.js and playback.worklet.js for dedicated audio processing threads.
Secure proxy: Python backend handles Google Cloud authentication.
If you prefer a simpler development process for specific telephony or WebRTC environments, we have third-party partner integrations with Daily, Twilio, LiveKit, and Voximplant. These platforms have integrated the Gemini Live API over the WebRTC protocol, allowing you to drop these capabilities directly into your existing voice and video workflows without managing the networking stack yourself .
Gemini Live API: Three production-ready demos
Once you have your foundation set with either template, how do you scale this into a product? We’ve built three demos showcasing the distinct “superpowers” of Gemini Live API.
1. Real-time proactive advisor agent
The core of building truly natural conversational AI lies in creating a partner, not just a chatbot. This specialized application demonstrates how to build a business advisor that listens to a conversation and provides relevant insights based on a provided knowledge base.
It showcases two critical capabilities for professional agents: Dynamic Knowledge Injection and Dual Interaction Modes.
The Scenario: An advisor sits in on a business meeting. It has access to specific injected data (revenue stats, employee counts) that the user defines in the UI.
Dual modes:
Silent mode: The advisor listens and “pushes” visual information via a show_modal tool without speaking. This is perfect for unobtrusive assistance where you want data, not interruption.
Outspoken mode: The advisor politely interjects verbally to offer advice, combining audio response with visual data.
Barge-in control: The demo uses activity_handling configurations to prevent the user from accidentally interrupting the advisor, ensuring complete delivery of complex advice when necessary.
Tool use: Uses a custom show_modal tool to display structured information to the user.
Check out the full source code for the real-time advisor agent implementation in our GitHub repository.
2. Multimodal customer support agent
Customer support agents must be able to act on what they “see” and “hear.” This demo layers Contextual Action and Affective Dialogue onto the voice stream, creating a support agent that can resolve issues instantly.
This application simulates a futuristic customer support interaction where the agent can see what you see, understand your tone, and take real actions to resolve your issues instantly. Instead of describing an item for a return, the user simply shows it to the camera. The agent combines this visual input with emotional understanding to drive real actions:
Multimodal Understanding: The agent visually inspects items shown by the customer (e.g., verifying a product for return) while listening to their request.
Empathetic Response: Using affective dialogue, the agent detects the user’s emotional state (frustration, confusion) and adjusts its tone to respond with appropriate empathy.
Action Taking and Tool Use: It doesn’t just chat; it uses custom tools like process_refund (handling transaction IDs) or connect_to_human (transferring complex issues) to actually solve the problem.
Real-time Interaction: Low-latency voice interaction using Gemini Live API over WebSockets.
Check out the full source code for the multi-modal customer support agent implementation in our GitHub repository.
3. Real-time video game assistant
Gaming is better with a co-pilot. In this demo, we build a Real-Time Gaming Guide that moves beyond simple chat to become a true companion that watches your gameplay and adapts to your style.
This React application streams both your screen capture and microphone audio to the model simultaneously, allowing the agent to understand the game state instantly. It showcases three advanced capabilities:
Multimodal awareness: The agent acts as a second pair of eyes, analyzing your screen to spot enemies, loot, or puzzle clues that you might miss.
Persona switching: You can dynamically toggle the agent’s personality – from a “Wise Wizard” offering cryptic hints to a “SciFi Robot” or “Commander” giving tactical orders. This demonstrates how system instructions can instantly change the voice and style of assistance.
Google Search Grounding: The agent pulls real-time information to provide up-to-date walkthroughs and tips, ensuring you never get stuck on a new level.
Check out the full source code for the real-time video game assistant implementation in our GitHub repository.
Get started today
Try it out today: Experiment with Gemini Live API in Vertex AI Studio
Start building: Access Gemini Live API on Vertex AI today and move beyond chatbots to create truly intelligent, responsive, and empathetic user experiences.
Get the code: All demos and quickstarts are available in our official GitHub repository.
Public sector agencies are under constant pressure to do more with less. With shrinking budgets and expanding responsibilities, the need for efficient, secure, and modern tools has never been greater. Outdated systems can hinder collaboration, create security risks, and impact employee morale, making it difficult to deliver the services constituents require.
Modernizing mission delivery
Google Workspace is a modern solution designed to meet these challenges head-on. It provides a unified, cloud-native platform with built-in AI to streamline workflows, enhance security, and foster seamless collaboration. To prove its value to your team, we invite you to the Google Workspace test drive. This no-cost 30-daypilot provides your agency with full, hands-on access to the entire suite, commitment-free.
Our team provides comprehensive support throughout the pilot, including:
Guided setup: We handle the technical setup and configuration to get you started quickly.
User onboarding: We provide hands-on training to ensure your team feels confident and capable.
Workflow testing: We help you test Google Workspace with your agency’s actual day-to-day tasks.
Impact assessment: We deliver a final report you can present to leadership, detailing the value and user feedback.
Secure, efficient AI you can trust
In the public sector, efficiency isn’t just about saving money—it’s about maximizing mission impact. Every dollar saved and every hour reclaimed is a resource that can be reinvested into serving the community, from improving public safety to delivering critical services. AI is the key to unlocking this potential, automating routine administrative tasks and freeing up public servants to focus on the high-value, human-centric work that truly makes a difference. This is where AI becomes a powerful ally. Google Workspace meets this challenge by embedding Gemini directly into the tools your team uses every day.
Underscoring our commitment to the public sector, Gemini in Workspace is the first generative AI assistant for productivity and collaboration suite to achieve FedRAMP High authorization. This certification allows government agencies to confidently deploy advanced AI tools, knowing sensitive data is protected within a stringent federal security framework. It enables agencies to leverage Gemini as a force multiplier, helping staff reclaim time and focus on mission-critical work.
This commitment to security extends to our partners in the Defense Industrial Base (DIB) as well. Google Public Sector recently achieved Cybersecurity Maturity Model Certification (CMMC) Level 2 Certification. This certification, validated by a certified third-party assessment organization (C3PAO), affirms that Google Public Sector’s internal systems used to handle Controlled Unclassified Information (CUI) meet the Department of Defense’s rigorous cybersecurity standards for protecting CUI.
Transforming workflows with Gemini
Imagine drafting a plan in minutes using “Help me write” in Docs, instantly summarizing a long email thread in Gmail, chatting with people in another language with instant translation, or getting automatic meeting notes and action items from Meet. This is the practical power of Gemini. The 30-day test drive is your opportunity to go beyond theory and see how these AI capabilities can transform your agency’s real-world workflows. Our team will guide you in developing workflows and collecting feedback, culminating in an assessment report for your leadership. Your team will have full access to experience how Gemini can reduce administrative burdens and accelerate productivity firsthand.
The U.S. Department of Transportation (DOT) selected Google Workspace as their new agency-wide collaboration suite, becoming the first cabinet-level agency to fully transition its workforce away from legacy providers to Google Workspace with Gemini, using the General Services Administration (GSA) OneGov Strategy. More than 50,000 DOT employees, including those from all transportation modes – ranging from the Federal Aviation Administration (FAA) to the National Highway Traffic Safety Administration (NHTSA) – will be able to take advantage of Workspace’s modern suite of cloud-based productivity and collaboration tools, including apps like Gmail, Docs, Drive, and Meet to help employees securely connect, create, and collaborate. More than 12,000 users have access today, with 40,000 more coming on in 2026.
The Google Workspace Test Drive has been a game-changer for our customers. Instead of lengthy pilots that often lose momentum, this focused 30 day sprint delivers quick wins and clear outcomes. Our clients walk away with tangible insights into how Google Workspace can improve collaboration and security, and we’re able to accelerate decision-making while building stronger executive alignment.
Sean Maday, CTO, Game Plan Tech
Take the next step
See the difference AI makes in mission delivery. Get 30 days of no-cost access to our FedRAMP High-authorized productivity suite with built-in AI. Sign up for the Google Workspace Test Drive to pilot Google Workspace with Gemini, on your own terms.
AWS DataSync Enhanced mode now supports data transfers between on-premises file servers and Amazon S3, enabling customers to transfer datasets that scale to virtually unlimited numbers of files at higher levels of performance than DataSync Basic mode.
AWS DataSync is a secure, high-speed file transfer service that optimizes data movement over a network. Enhanced mode uses parallel processing to deliver higher performance and scalability for datasets of any size, while removing file count limitations and providing detailed transfer metrics for better monitoring and management. Previously, Enhanced mode was available for data transfers between Amazon S3 locations and for multicloud transfers. This launch extends the capabilities of Enhanced mode to support transfers between on-premises NFS or SMB file servers, and Amazon S3. Using Enhanced mode, customers can accelerate generative AI workloads by rapidly moving training datasets to AWS, power data lake analytics by synchronizing on-premises data with cloud-based pipelines, and drive large-scale migrations for archival and cloud modernization.
We are excited to announce that Amazon EMR Managed Scaling is now available for EMR on EC2 customers in the Asia Pacific (Malaysia, New Zealand, Taipei, Thailand), Canada West (Calgary), Mexico (Central), and US Gameday Northeast (Illinois) AWS Regions. Amazon EMR Managed Scaling automatically resizes the EC2 instances in your EMR cluster for the best performance at the lowest possible cost.
With Amazon EMR Managed Scaling, you simply specify the minimum and maximum compute limits for your clusters, and Amazon EMR on EC2 automatically resizes your cluster for optimal performance and resource utilization. Amazon EMR Managed Scaling constantly monitors key workload-related metrics and uses an algorithm that optimizes the cluster size for the best resource utilization. Using this algorithm, Amazon EMR can scale the EC2 cluster up during peaks and scale it down during idle periods, reducing your costs and optimizing cluster capacity for the best performance. Amazon EMR Managed Scaling can also be used with Amazon EC2 Spot Instances, that lets you take advantage of unused EC2 capacity for a discount when compared to on-demand prices.
Amazon EMR Managed Scaling is now available in all AWS commercial regions.
Amazon EMR Managed Scaling is supported for Apache Spark, Apache Hive and YARN-based workloads on Amazon EMR on EC2 versions 6.14 and above. To learn more and to get started, visit the Amazon EMR Managed Scaling user guide.
Today, AWS Shield announces multi-account network security management and automated network analysis for network security director, which is currently in preview. AWS Shield network security director provides visibility into the AWS resources in your AWS organization, identifies missing or misconfigured network security services, and recommends remediation steps.
With network security director, you can specify a delegated administrator account from which you can start continuous network analysis for multiple accounts or organizational units in your AWS Organization. You can then centrally view each account’s network topology, network security findings, and recommended remediations for missing or misconfigured network security services. You can also easily summarize and report on the network security misconfigurations identified by AWS Shield network security director from within Amazon Q Developer in the AWS Management Console and chat applications.
AWS Shield network security director is also now available in five additional AWS regions: Europe (Ireland), Europe (Frankfurt), Asia Pacific (Hong Kong), Asia Pacific (Singapore), and Australia (Sydney).