Starting today, Amazon EC2 Instance Connect and EC2 Serial console are also available in AWS Asia Pacific (Malaysia), AWS Asia Pacific (Thailand) and AWS Mexico (Central) regions.
EC2 Instance Connect allows customers to connect to their instances over Secure Shell (SSH) with a single click from the EC2 console and single command from the AWS CLI. Customers can manage access to instances with AWS Identity and Access Management (IAM) policies as well as generate one-time use SSH keys enhancing the security posture for connectivity. EC2 Serial Console provides customers a simple way to interactively troubleshoot boot and network connectivity issues by establishing a connection to the serial port of an instance. EC2 Serial Console is ideal for situations where you are unable to connect to your instance via normal SSH or RDP connections.
To get started, you can navigate to the Amazon EC2 console, select the instance you want to connect to and with a single click connect using EC2 Serial Console or Instance Connect. You can also connect from the AWS CLI or API. To learn more see our documentation.
The evolution of the cloud has been tremendous over the past decade. Every step of the way, Google Kubernetes Engine (GKE) has been there to meet new challenges. From giving DevOps more scalable foundations to supporting the rise of cloud-native AI, we took Kubernetes’ brilliance and gave it the fully managed service it deserved to thrive.
GKE turns 10 this year, and to celebrate, we’ve launched 10 years of GKE, an ebook that explores this incredible decade and how customers have built global businesses powered on this managed platform. We released Kubernetes as open source in 2014, and one million contributions later, we couldn’t be prouder of what Kubernetes has become, its history, and its future with GKE.
GKE’s leading lights
One of the earliest GKE customers was Signify, a global leader in lighting for professionals and the company behind Philips Hue. Ten years on, it continues to thrive on the service. Growing from 200 million to 3.5 billion daily transactions, Signify scaled from one GKE cluster to seven, and is looking to leverage GKE for new workloads, including platform engineering and AI for multi-cluster supervision.
“The constant improvements made by GKE over the past 10 years profoundly changed the way we design, deploy, and evolve our services,” says Leon Bouwmeester, Director of Engineering and Head of Hue Platform at Signify. “We spend less time on infrastructure management and can focus our efforts on what really matters: the quality of the user experience and the speed of innovation.”
However, what put GKE on the map was Pokémon GO, Niantic’s ground-breaking geolocation game. As millions took to the streets to catch ‘em all, GKE brought to life and kept up with its explosive launch. “Never have I taken part in anything close to the growth that Google Cloud customer Niantic experienced with the launch of Pokémon GO,” says Luke Stone, director of customer reliability engineering at Google Cloud.
Target vs. worst case vs. actual traffic to GKE during Niantic’s launch of Pokémon Go.
AI for tomorrow on GKE today
Today, GKE supports brand new businesses in the rapidly evolving world of AI. Customers report how their AI initiatives are made more powerful on GKE, helping them manage the complex demands of their deployments. This means flexibility and scale for AI workloads and cost-efficient inference — so you can focus on training, not managing.
With GKE Autopilot, AI can also help you optimize your configurations and workloads. In the ebook, learn more about how GKE Autopilot mode frees up teams to focus on innovation, with businesses sharing how they automatically improved performance and cost savings — with the stability and security they expect from Google Cloud.
Join the celebration by exploring 10 years of GKE for yourself. We‘ve distilled a decade of insights into what makes GKE so effective, thoughts from customers on how GKE is supporting their work at scale, and why we’re ready for everything AI has in store for the decade ahead. It’s been an amazing ride, and with AI reshaping the future of application development, we’re just getting started.
aside_block
<ListValue: [StructValue([(‘title’, ‘$300 in free credit to try Google Cloud containers and Kubernetes’), (‘body’, <wagtail.rich_text.RichText object at 0x3e1ececfbf40>), (‘btn_text’, ‘Start building for free’), (‘href’, ‘http://console.cloud.google.com/freetrial?redirectpath=/marketplace/product/google/container.googleapis.com’), (‘image’, None)])]>
Securing sensitive data is a crucial part of moving workloads to the cloud. While encrypting data at rest and in transit are standard security practices, safeguarding data in use — while it’s actively being processed in memory — can present unique security and privacy challenges.
To make sure that data in use is also protected, we developed Confidential Computing with our hardware partners to use hardware-based Trusted Execution Environments (TEEs) to isolate and safeguard data in use, even from the cloud provider hosting the data.
To help build a secure and reliable cloud environment, we’ve partnered with SUSE, a global leader in open source and secure enterprise solutions. Together, we’ve developed targeted solutions that can enable organizations to run their sensitive workloads in the cloud, combining the hardware-based security of Google Cloud Confidential Virtual Machines (Confidential VMs) with the security of SUSE Linux Enterprise Server (SLES).
Today, we are excited to announce that SUSE Linux Enterprise Server now supports Google Cloud Confidential VMs that have Confidential Computing technologies AMD SEV, AMD SEV-SNP, or Intel TDX enabled. Previously, SLES was only generally available on AMD SEV and AMD SEV-SNP-based Confidential VMs, but now SLES is also generally available on Intel TDX-based Confidential VMs which run on the performant C3 machine series. This new offering provides customers more choice and flexibility in securing sensitive workloads, while expanding Confidential VM support for guest operating system images.
aside_block
<ListValue: [StructValue([(‘title’, ‘$300 in free credit to try Google Cloud security products’), (‘body’, <wagtail.rich_text.RichText object at 0x3e1ececa2790>), (‘btn_text’, ‘Start building for free’), (‘href’, ‘http://console.cloud.google.com/freetrial?redirectPath=/welcome’), (‘image’, None)])]>
At Google Cloud, we strongly advocate for a layered approach to security. Here, SUSE Linux Enterprise Server (SLES) strengthens the guest OS layer, while Confidential VMs strengthen the infrastructure layer. Additionally, the comprehensive SLES security portfolio can help support compliance, risk mitigation, and cybersecurity best practices:
Meeting compliance requirements: SLES is designed to help organizations meet regulatory requirements through its security features. SLES comes with Federal Information Processing Standards (FIPS) 140-3 certified cryptographic modules.
Reducing evaluation effort: Utilizing SLES with supplier certifications can help customers streamline their evaluation processes by referencing existing certifications.
Hardening automatically: SLES includes an automated hardening process that can help with Security Technical Implementation Guide (STIG)-compliant hardening during setup with YAST or AutoYAST, which can be adjusted as needed.
The combination of SLES within Google Cloud Confidential VMs can offer several benefits:
Complementing encryption with a secure OS: With its security focus and certifications, SLES can provide a hardened operating system in a trusted environment, making both applications and the OS less susceptible to vulnerabilities.
Supporting integrity and trustworthiness: Customers can have greater confidence that both the hardware and the operating system are working as expected. Confidential VMs offer remote attestation, allowing verification of the VM identity and state. Running a secure OS, such as SLES, on an attested Confidential VM can support overall data and code integrity.
Supporting Confidential Computing technologies: By providing a consistent and secure operating system across all Google Cloud Confidential Computing types (AMD SEV, AMD SEV-SNP, and Intel TDX), SLES can help simplify the deployment and management of sensitive cloud workloads.
Enhancing compliance in sensitive environments: For workloads that require a notable level of data protection due to compliance regulations, this joint security solution of SLES on Confidential VMs can help alleviate cloud migration concerns from internal auditors.
Addressing internal and external threats: While Confidential Computing primarily can help protect against external threats like hypervisors, running a security-focused OS like SLES in a Confidential VM can offer an additional layer of protection against potential internal vulnerabilities in the guest OS itself.
Reinforcing data ownership and control: Confidential Computing can help provide technical assurances that you have retained control and effective ownership of your data, even when your data is processed in the cloud. By encrypting data in use and limiting access to only your authorized workloads within a TEE, you can gain stronger assurances for your digital sovereignty.
Extending Zero Trust to execution: By encrypting data in memory on the CPU, this solution extends the Zero Trust principle of “never trust, always verify” to data even when it’s actively being processed. This ensures data remains secure and encrypted throughout its lifecycle, including during execution, helping to enforce a real Zero Trust environment.
Establishing a secure foundation for cloud-native workloads: With SLES providing a secure base and Google Cloud Confidential VMs offering hardware-level protection, this environment together with SUSE Cloud Native solutions can deliver a robust foundation for your most sensitive cloud-native applications. By securing the underlying compute resources, you can extend data-in-use protection to higher level containerized and cloud-native workloads.
Organizations can confidently move regulated and confidential applications to Google Cloud, knowing their data is supported throughout its lifecycle, including while in use and with a secure guest OS, to bolster their digital sovereignty.
Broadcom’s VMware vSphere product remains a popular choice for private cloud virtualization, underpinning critical infrastructure. Far from fading, organizations continue to rely heavily on vSphere for stability and control. We’re also seeing a distinct trend where critical workloads are being repatriated from public cloud services to these on-premises vSphere environments, influenced by strategies like bimodal IT and demands for more operational oversight.
The common practice of directly integrating vSphere with Microsoft Active Directory (AD), while simplifying administration tasks, creates an attack path frequently underestimated due to a misunderstanding of the inherent risks presented today. This configuration extends the AD attack surface directly to the hypervisor. From a threat actor’s perspective, this integration constitutes a high-value opportunity. It transforms the relatively common task of compromising AD credentials into a potential high value scenario, granting access to the underlying infrastructure hosting the servers and in turn allowing them to gain privileged administrative control over ESXi hosts and vCenter and ultimately seize complete command of the virtualized infrastructure.
Ransomware aimed at vSphere infrastructure, including both ESXi hosts and vCenter Server, poses a uniquely severe risk due to its capacity for immediate and widespread infrastructure paralysis. With the end of general support for vSphere 7.x approaching in October 2025—the version Mandiant has observed to be running by a large majority of organizations—the threat of targeted ransomware has become urgent. As recovering from such an attack requires substantial time and resources, proactive defense is paramount. It is therefore critical for organizations to understand the specific threats against these core components and implement effective, unified countermeasures to prevent their compromise, especially before support deadlines introduce additional risk.
This blog post will logically break down the inherent risks and misunderstandings with integrating vSphere with Microsoft AD. Using Mandiant’s deep experience of both vSphere ransomware incidents and proactive assessments of both AD and vSphere, we will provide a directive for understanding risk and increasing security posture aligned with today’s threats in respect of enterprise vSphere management.
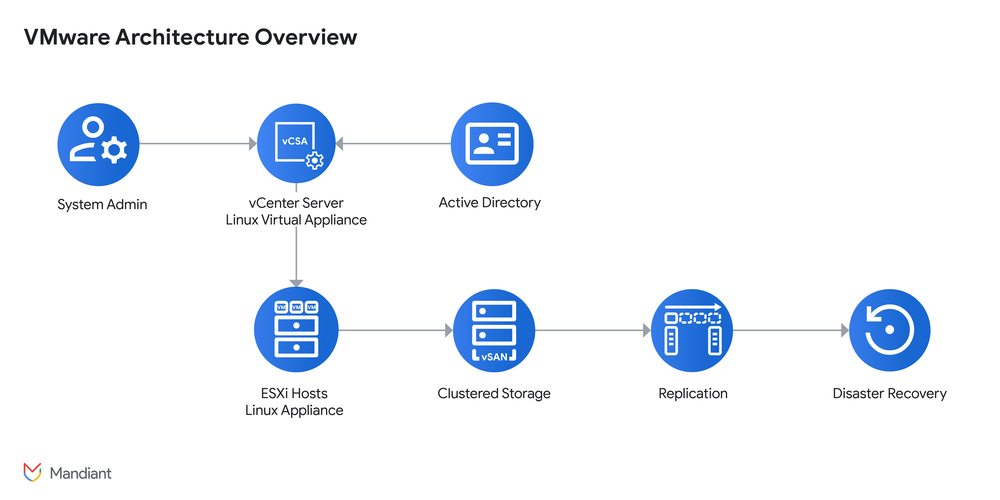
To understand the security risks in a vSphere environment, it’s essential to understand its architecture. A compromise at one layer can have cascading effects throughout the entire virtualized environment.
At its core, vSphere is a platform that pools physical datacenter resources like compute, storage, and networking into a flexible layer of virtual infrastructure, a task primarily accomplished by two key components, ESXi and vCenter, as shown in the following diagram:
ESXi (The Hypervisor): This is the foundational layer of vSphere. ESXi is a bare metal hypervisor, meaning it installs directly onto the physical server hardware without requiring an underlying operating system. Its core job is to partition that server into multiple, isolated virtual machines (VMs). Each VM, which is essentially just a collection of files, runs its own operating system and applications, acting like an independent computer. The hypervisor’s minimal design is intentional, aiming to reduce its own attack surface while efficiently managing the server’s resources.
vCenter (The Control Plane): If ESXi hosts are the workers, the vCenter Server is the “brain” or control plane for the entire environment. It provides a single web-based interface to manage all connected ESXi hosts and the VMs they run. ESXi hosts are registered with vCenter, which uses agents on each host to manage operations and enable advanced features like automatic workload balancing and high availability for failover protection.
Integrating vSphere with AD creates a flexible environment that simplifies identity management, yet it introduces profound security risks. This direct link can turn an AD compromise into a significant threat against the entire vSphere deployment.
An Outdated Blueprint: Re-examining Foundational vSphere Security
Virtualization has been a cornerstone of enterprise IT for nearly two decades, solving server sprawl and delivering transformative operational agility. Alongside it, AD remains a pillar of enterprise IT. This has led to a long-standing directive that all enterprise technology, including critical infrastructure like vSphere, must integrate with AD for centralized authentication. The result is a risky dependency—the security of foundational infrastructure is now directly tied to the security of AD, meaning any compromise within AD becomes a direct threat to the entire virtualization environment.
In the past, vSphere security was often approached in distinct, siloed layers. Perimeter security was stringent, and threats were typically viewed as internal, such as configuration errors, rather than from external threat actors. This, combined with the newfound ease of image-based backups, often led to security efforts becoming primarily focused on robust business continuity and disaster recovery capabilities over proactive defense. As environments expanded, managing local user accounts created significant administrative overhead, so support for AD integration was introduced for centralized identity management.
Mandiant’s observation, based on extensive incident response engagements, is that many vSphere environments today still operate on this foundational architecture, carrying forward security assumptions that haven’t kept pace with the evolving threat landscape. As Mandiant’s assessments frequently identify, these architectures often prioritize functionality and stability over a security design grounded in today’s threats.
So what’s changed? Reliance solely on perimeter defenses is an outdated security strategy. The modern security boundary focuses on the user and device, typically protected by agent-based EDR solutions. But here lies the critical gap: The ESXi hypervisor, a purpose-built appliance, which, contrary to what many people believe, is not a standard Linux distribution. This specialized architecture inherently prevents the installation of external software, including security tools like EDR agents. vSphere documentation explicitly addresses this, stating:
“The ESXi hypervisor is a specialized, purpose-built solution, similar to a network router’s firmware. While this approach has several advantages, it also makes ESXi unable to run “off-the-shelf” software, including security tools, designed for general-purpose operating systems as the ESXi runtime environment is dissimilar to other operating systems.
The use of Endpoint Detection and Response (EDR) and other security practices inside third-party guest operating systems is supported and recommended.”
Consequently, most organizations focus their security efforts and EDR deployment inside the guest operating systems. This leaves the underlying ESXi hypervisor—the foundation of the entire virtualization environment—as a significant blind spot for security teams.
The vSphere Threat Landscape
The security gap at the hypervisor layer, which we detailed in the previous section, has not gone unnoticed by threat actors. As security for Windows-based operating systems matured with advanced EDR solutions, threat actors have pivoted to a softer, higher-value target—the ESXi hypervisor itself.
This pivot is amplified by common operational realities. The critical role of ESXi hosts often leads to a hesitancy to apply patches promptly for fear of disruption. Many organizations face a rapidly closing window to mitigate risks; however, threat actors aren’t just relying on unpatched vulnerabilities. They frequently leverage compromised credentials, a lack of MFA, and simple misconfigurations to gain access.
The Rise of Hypervisor-Aware Ransomware
Ransomware targeting vSphere is fundamentally more devastating than its traditional Windows counterpart. Instead of encrypting files on servers or end user compute, these attacks aim to cripple the entire infrastructure by encrypting virtual disk files (VMDKs), disabling dozens of VMs at once.
This is not a theoretical threat. According to Google Threat Intelligence Group (GTIG), the focus on vSphere is rapidly increasing. Of the new ransomware families observed, the proportion specifically tailored for vSphere ESXi systems grew from ~2% in 2022 to over 10% in 2024. This demonstrates a clear and accelerating trend that threat actors are actively dedicating resources to build tooling that specifically targets the hypervisor. In incidents investigated by GTIG, threat actors most frequently deployed REDBIKE, RANSOMHUB, and LOCKBIT.BLACK variants.
GTIG analysts have also noted a recent trend for threat actors to gain persistence to vSphere environments via reverse shells deployed on Virtual center. This enables a foothold to be obtained within the vSphere control plane and thus complete control over all infrastructure. This would typically manifest in into a two-pronged approach: a tactical data exfiltration such as an AD database (NTDS.dit) and then the deployment of ransomware and mass encryption of all VMs.
Understanding the Active Directory Integration in vSphere
The decision to integrate vSphere with AD often overlooks the specifics of how this connection actually works. To properly assess the risk, we must look beneath the surface at the technical components that enable this functionality. This analysis will deconstruct those key pieces: the legacy agent responsible for authentication, its inherent inability to support modern security controls like multi-factor authentication (MFA), and the insecure default trust relationships it establishes. By examining these foundational mechanisms, we can expose the direct line from a credential compromise to an infrastructure takeover.
vSphere’s Likewise Agent
When discussing vSphere’s integration with AD, it’s essential to distinguish between two separate components: vCenter Server and the ESXi hosts. Their respective AD integration options are independent and possess different capabilities. This connection is entirely facilitated by the Likewise agent.
The Likewise agent was originally developed by Likewise Software to allow Linux and Unix-based systems to join AD environments, enabling centralized identity management using standard protocols like Kerberos, NTLM, and LDAP/(S). The open-source edition, Likewise Open, included tools such as domainjoin-cli and system daemons like lsassd, which are still found under the hood in ESXi and the vCenter Server Appliance (VCSA). vSphere embedded this agent starting with ESX 4.1 (released in 2010) to facilitate Integrated Windows Authentication (IWA). However, its function differs:
In ESXi, the Likewise agent actively handles AD user authentication when configured.
In vCenter, it is only used for the initial domain join when Integrated Windows Authentication (IWA) is selected as the identity source—all actual authentication is then handled by the vCenter Single Single On (SSO) subsystem.
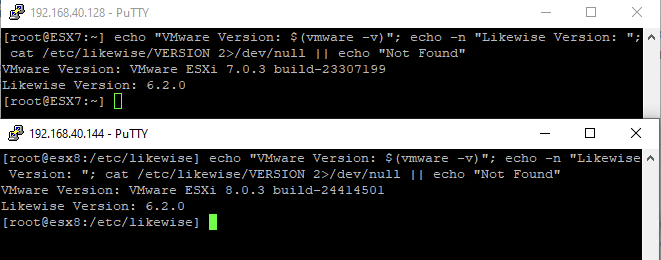
The original Likewise Software was eventually absorbed by BeyondTrust, and the open-source edition of the agent is no longer actively maintained publicly. The Likewise OSS project is now archived and marked as inactive. It is understood the codebase is only maintained internally. Note: The agent’s build version remains identical at Likewise Version 6.2.0 across both ESXi 7 and 8.
Figure 1: ESXi Likewise Agent versions
The following table lists comparisons between native AD connection methods for both Virtual Center and ESXi.
Feature / Capability
ESXi Host
vCenter Server (VCSA)
AD Integration Method
Integrated Windows Authentication (IWA) only
IWA and LDAP/LDAPS
Federated Identity (SAML, OIDC)
Likewise Agent Used
Yes – exclusively for IWA domain join and authentication
Yes – Used for IWA domain join only
Authentication Protocols Supported
Kerberos (via IWA only)
Kerberos (IWA), LDAP(S), SAML, OIDC
Modern Auth Support (OIDC, SAML, FIDO2)
Not supported
Not supported via AD
Supported onlywhen using federated IdPs
MFA Support
Not supported
Not supported viaAD DS
Supported via Identity Federation (ADFS, Azure AD, etc.)
Granular Role-Based Access Control (RBAC)
Limited (via host profile or CLI only)
Advanced RBAC with vCenter SSO
Why Not to Use Likewise-Based AD Integration (ESXi/vCenter)
The following list contains considerations when using AD-based connections managed by the vSphere Likewise agent:
Deprecated software: Likewise is legacy software, no longer maintained or supported upstream.
No support for modern authentication: Likewise only supports Integrated Windows Authentication (Kerberos) and offers no support for SAML, OIDC, or FIDO2.
No MFA: Likewise cannot enforce contextual policies such as MFA, geolocation restrictions, or time-based access.
Credential material stored locally: Kerberos keytabs and cached credentials are stored unencrypted on disk.
VMware recommends leveraging identity federation with modern identity providers, bypassing the limitations of the legacy Likewise-based stack. Broadcom announced on March 25 that IWA will be removed in the next major release.
The MFA Gap
While AD integration offers administrative convenience, it introduces significant security limitations, particularly regarding MFA. Traditional AD authentication methods, including Kerberos and NTLM, are inherently single-factor. These protocols do not natively support MFA, and the vCenter Likewise integration does not extend AD MFA enforcement to vCenter or ESXi.
Critically, ESXi does not support MFA in any form, nor does it support identity federation, SAML, or modern protocols such as OIDC or FIDO2. Even for vCenter, MFA can only be applied to users within the vSphere.local domain (using mechanisms like RSA SecurID or RADIUS), but not to AD-joined users authenticated through IWA or LDAP/S.
Ancillary solutions can offer proxy-based MFA that integrate with AD to enforce MFA to vSphere. AuthLite extends the native AD login process by requiring a second factor during Windows authentication, which can indirectly secure vCenter access when Integrated Windows Authentication is used. Silverfort operates at the domain controller level, enforcing MFA on authentication flows in real time without requiring agents on endpoints or changes to vCenter. Both solutions can help enforce MFA into vSphere environments that lack native support for it, but they can also introduce caveats such as added complexity and potential authorization loops if AD becomes dependent on the same infrastructure they protect and the need to treat their control planes or virtual appliances as Tier 0 systems within the vSphere environment.
As a result, in organizations that integrate vSphere with traditional Active Directory, all access to critical vSphere infrastructure (ESXi and Virtual Center) remains protected by password alone and no MFA.
While it is technically possible to enforce MFA in vSphere through Active Directory Federation Services (ADFS), this approach requires careful consideration. It is important to note that ADFS is still a feature included in Windows Server 2025 and is not on any official deprecation list with an end-of-life date. However, the lack of significant new feature development compared to the rapid innovation in Microsoft Entra ID speaks to its status as a legacy technology. This is underscored by the extensive migration resources Microsoft now provides to move applications away from AD FS and into Entra ID.
Therefore, while ADFS remains a supported feature, for the purposes of securing vSphere it is a complex workaround that doesn’t apply to direct ESXi access and runs contrary to Microsoft’s clear strategic direction toward modern, cloud-based identity solutions.
Another common approach involves Privileged Access Management (PAM). While a PAM-centric strategy offers benefits like centralized control and session auditing, several caveats warrant consideration. PAM systems add operational complexity, and the vCenter session itself is typically not directly federated with the primary enterprise identity provider (like Entra ID or Okta). Consequently, context-aware conditional access policies are generally applied only at the initial PAM logon, not within the vCenter session itself.
Ultimately, these workarounds do not address the core issue: vSphere’s reliance on the Likewise agent and traditional AD protocols prevents native MFA enforcement for AD users, leaving the environment vulnerable.
There is a reliance on a delegated logon based on AD password complexity, and any MFA would have to be at the network access layer or workstation login, not at the vCenter login prompt for those users.
The ‘ESX Admins’ Problem Is Not an ESXi Issue, It’s a Trust Issue
In July 2024, Microsoft published a blog post on CVE-2024-37085, an “ESXi vulnerability” that was considered a critical issue, and one that vSphere promptly addressed in a patch release. The CVE, present in vSphere ESXi for many years, involved several ESXi advanced settings utilizing insecure default configurations. Upon joining an ESXi host to an AD domain, the “ESX Admins” AD group is automatically granted an ESXi Admin role, potentially expanding the scope of administrative access beyond the intended users.
These settings are configured by the following ESXi controls:
What it does: This setting controls whether users from a designated administrators group are automatically added to the host’s local administrative group.
What it does: This setting defines the time interval at which the host’s management services validate the authentication credentials (or tickets) of connected clients.
Config.HostAgent.plugins.hostsvc.esxAdminsGroup
What it does: This parameter specifies the name (or identifier) of the group whose members are to be automatically considered for host administrative privileges (when auto-add is enabled by the first setting).
Config.HostAgent.plugins.hostsvc.esxAdminsGroupAutoAdd from true to false
Config.HostAgent.plugins.vimsvc.authValidateInterval from 1440 to 90
Config.HostAgent.plugins.hostsvc.esxAdminsGroup from “ESX Admins” to “”
The following is a configuration fix to default settings in vSphere ESXi 8.0 Update 3:
Config.HostAgent.plugins.hostsvc.esxAdminsGroupAutoAdd from true to false
Config.HostAgent.plugins.vimsvc.authValidateInterval from 1440 to 90
Config.HostAgent.plugins.hostsvc.esxAdminsGroup no change “ESX Admins”
Integrating an ESXi host with Microsoft AD introduces a fundamental security issue that is often overlooked—the IdP’s administrators effectively gain administrative control over the ESXi host and any other system relying on that trust. While a common perception, sometimes reinforced by narratives focusing on the endpoint, suggests the ESXi host itself is the primary vulnerability, the more critical security concern is the implicit, far-reaching administrative power wielded by the administrators of the trusted IdP, particularly when using AD authentication with ESXi.
Administrators of Active Directory implicitly become administrators of any ESXi host that trusts it.
Consequently, neither workarounds nor configuration fixes, which only adjust default settings, resolve this core problem when an ESXi host is joined to AD. The issue transcends specific CVEs; it stems from the inherent security implications of the implicit trust model itself, particularly when it involves systems like ESXi and AD, which already possess their own security vulnerabilities and are frequent targets for threat actors.
In respect of ESXi, context should be applied to the following:
Automatic full administrative access: When ESXi hosts are joined to AD, a default (or custom configured) AD group (e.g., “ESX Admins”) is granted full root-level administrative privileges on the ESXi hosts. Any member of this AD group instantly gains unrestricted control of the ESXi host.
Group name: If AD is compromised, threat actors can manipulate anygroup name used for via the the Config.HostAgent.plugins.hostsvc.esxAdminsGroup advanced setting, This is not limited to the group name “ESX Admins.”
Lack of security identifier (SID) tracking: AD group names (not limited to “ESX Admins”) added to ESXi are not tracked by their SIDs. This means that a threat actor could rename or recreate a deleted AD group such as “ESX Admins” maintaining the same name in ESXi via Config.HostAgent.plugins.hostsvc.esxAdminsGroup and retain the elevated privileges. This is a limitation of the Likewise ESXi agent.
Active Directory group management. Any threat actor looking to access a domain-joined ESXi host would need to simply require sufficient permissions to add themselves to the AD group defined via Config.HostAgent.plugins.hostsvc.esxAdminsGroup.
Recent discussions around vulnerabilities like CVE-2024-37085 have brought this security issue to the forefront: the inherent dangers of joining vSphere ESXi hosts directly to an AD domain. While such integration offers perceived management convenience, it establishes a level of trust that can be easily exploited.
Why Your ESXi Hosts Should Never Be Active Directory Domain Joined
Based on previous discussions we can confidently establish that joining an ESXi host to AD carries substantial risk. This is further endorsed where there is an absence of comprehensive ESXi security controls such as Secure Boot, TPM, execInstalledOnly, vCenter integration, comprehensive logging and SIEM integration. Compromised AD credentials tied to an ESXi-joined group will allow remote threat actors to readily exploit the elevated privileges, executing actions such as virtual machine shutdown and ransomware deployment via SSH. These risks can be summarized as follows:
No MFA support: ESXi does not support MFA for AD users. Domain joining exposes critical hypervisor access to single-factor password-based authentication.
Legacy authentication protocols: ESXi relies on IWA and Kerberos / NTLM / Windows Session Authentication (SSPI)—outdated protocols vulnerable to various attacks, including pass-the-hash and credential relay.
Likewise agent is deprecated: The underlying Likewise agent is a discontinued open-source project. Continued reliance on it introduces maintenance and security risks.
No modern authentication integration: ESXi does not support federated identity, SAML, OIDC, FIDO2, or conditional access.
AD policy enforcement is absent: Group Policy Objects (GPOs), conditional access, and login time restrictions do not extend to ESXi via AD join, undermining centralized security controls.
Complexity without benefit: Domain joining adds administrative overhead without offering meaningful security gains — especially when using vCenter as the primary access point.
Limited role mapping granularity: Group-based role mappings on ESXi are basic and cannot match the RBAC precision available in vCenter, reducing access control fidelity.
To securely remove ESXi hosts from AD, a multistep process is required to shift access management explicitly to vCenter. This involves assessing current AD usage, designing granular vCenter roles, configuring vCenter’s RBAC, removing hosts from the domain via PowerCLI, and preventing future AD re-integration. All management then moves to vCenter, with direct ESXi access minimized. This comprehensive approach prioritizes security and efficiency by moving away from AD reliance for ESXi authentication and authorization towards a vCenter-centric, granular RBAC model. vSphere explicitly discourages joining ESXi hosts to AD:
“ESXi can be joined to an Active Directory domain as well, and that functionality continues to be supported. We recommend directing all configuration & usage through the Role-Based Access Controls (RBAC) present in vCenter Server, though.”
vSphere vCenter Server represents a strategic objective for threat actors due to its authoritative role as the centralized management for virtualized infrastructure. A compromised vCenter instance effectively cedes comprehensive administrative control over the entire virtual estate, encompassing all connected ESXi hypervisors, virtual machines, datastores, and virtual network configurations.
Through its extensive Application Programming Interfaces (APIs), adversaries can programmatically manipulate all managed ESXi hosts and their resident virtual machines, enabling actions such as mass ransomware deployment, large-scale data exfiltration, the provisioning of rogue virtual assets, or the alteration of security postures to evade detection and induce widespread operational disruption.
Furthermore, the vCenter Server appliance itself can be subverted by implanting persistent backdoors, thereby establishing covert command-and-control (C2) channels that allow for entrenched persistence and continued malicious operations. Consequently, its critical function renders vCenter a high-value target. The following should be considered:
Coupled security dependency (compromise amplification risk): Directly linking vCenter to AD makes vSphere security dependent on AD’s integrity. As AD is a prime target, compromising privileged AD accounts mapped to vCenter grants immediate, potentially unrestricted administrative access to the virtual infrastructure, bypassing vSphere-specific security layers. Insufficient application of least privilege for AD accounts in vSphere magnifies this risk.
Single-factor authentication weakness (credential compromise risk): Relying solely on AD password validation makes vCenter highly vulnerable to common credential compromise methods (phishing, brute-force, spraying, stuffing, malware). Without mandatory MFA, a single stolen password for a privileged AD account allows complete authentication bypass, enabling unauthorized access, data breaches, ransomware, or major disruptions.
Lack of native MFA: The direct vsphere.local-to-AD integration offers no built-in enforcement of strong authentication like phishing resistant FIDO2 . While compatibility exists for external systems (Smart Cards, RSA SecurID), these require separate, dedicated infrastructure and are not inherent features, leaving a significant authentication assurance gap if unimplemented.
Facilitation of lateral movement and privilege escalation: Compromised AD credentials, even non-administrative ones with minimal vSphere rights, allow threat actors initial vCenter access. vCenter can then be exploited as a pivot point for further network infiltration, privilege escalation within the virtual environment, or attacks on guest systems via console/API access, all stemming from the initial single-factor credential compromise.
Integrating vSphere vCenter directly with AD for identity management, while common, inherently introduces significant security vulnerabilities stemming from coupled dependencies, reliance on single-factor authentication, a lack of native strong MFA, and facilitated attack pathways. These not only critically expose the virtual infrastructure but also provide avenues to exploit the VCSA appliance’s attack surface, such as its underlying Linux shell and the lack of comprehensive endpoint detection and response (EDR) capabilities.
Securing vSphere: The Tier 0 Challenge
The widespread practice of running Tier 0 services—most critically, AD domain controllers (often used for direct Identity integration)—directly on vSphere hypervisors introduces a significant and often overlooked security risk. By placing Active Directory Domain Controllers on vSphere, any successful attack against the hypervisor effectively hands threat actors the keys to the entire AD environment, enabling complete domain takeover. Mandiant observes that a general lack of awareness and proactive mitigation persists.
The danger is significant and present, for example, even for vSphere permissions that appear low-risk or are operationally common. For example, the privilege to snapshot an AD virtual machine can be weaponized for complete AD takeover. This specific vSphere capability, often assigned for backup routines, enables offline NTDS.dit (AD database) exfiltration. This vSphere-level action renders many in-guest Windows Server security controls ineffective, bypassing not only traditional measures like strong passwords and MFA, but also advanced protections such as LSASS credential guard and EDR, which primarily monitor activity within the operating system. This effectively paves a direct route to full domain compromise for a threat actor possessing this specific permission.
Mandiant observed these tactics, techniques, and procedures (TTPs) attributed to various ransomware groups across multiple incidents. The absence of VM encryption and logging makes this a relatively simple task to obtain the AD database while being undetected.
The following table contains a list of sample threats matched to related permissions:
Threat
Risk
Minimum vSphere Permission Required
Unencrypted vMotion
Memory-in-transit (e.g., LSASS, krbtgt hashes) can be captured during migration.
Role: Virtual Machine Power User or higher Permission: Host > Inventory > Migrate powered on virtual machine
Unencrypted VM Disks
AD database (NTDS.dit), registry hives, and password hashes can be stolen from VMDKs.
Role: Datastore Consumer, VM Admin or higher. Permission Datastore > Browse, Datastore > Low level file operations
Snapshot Creation
Snapshots preserve memory and disk state; can be used to extract in-memory credentials.
Role: Virtual Machine Power User or higher. Permission: Virtual Machine > State > Create Snapshot
Mounting VMDK to another VM
Enables offline extraction of AD secrets (e.g., NTDS.dit, registry, SYSVOL).
Role: VM Admin or custom with disk-level access. Permission Virtual Machine > Configuration > Add existing disk, Datastore > Browse
Exporting / Cloning VM
Enables offline AD analysis, allowing credential extraction or rollback attacks.
Delegation of trust from vSphere vCenter to AD grants implicit administrator privileges on the trusted systems to any AD domain administrator. This elevates the risk profile of AD compromise, impacting the entire infrastructure. To mitigate this, implement a two-pronged strategy: first, create a separate, dedicated vSphere environment specifically for the most critical Tier 0 assets, including AD. This isolated environment should be physically or logically separated from other systems and highly secured with robust network segmentation. Second, implement a zero-trust security model for the control plane of this environment, verifying every access request regardless of source. Within this isolated environment, deploy a dedicated “infrastructure-only” IdP (on-premises or cloud). Implementing the principle of least privilege is paramount.
A dedicated, isolated vSphere environment for Tier 0 assets (e.g., Active Directory) should have strictly limited administrative access (via a PAW), granting permissions only to those directly managing the infrastructure. This significantly reduces the impact of a breach by preventing lateral movement and minimizing damage. Unnecessary integrations should be avoided to maintain the environment’s security and adhere to the least-privilege model.
To effectively safeguard critical Tier 0 assets operating within the vSphere environment–specifically systems like Privileged Access Management (PAM), Security Information and Event Management (SIEM) virtual appliances, and any associated AD tools deployed as virtual appliances–a multilayered security approach is essential. These assets must be treated as independent, self-sufficient environments. This means not only isolating their network traffic and operational dependencies but also, critically, implementing a dedicated and entirely separate identity provider (IdP) for their authentication and authorization processes. For the highest level of assurance, these Tier 0 virtual machines should be hosted directly on dedicated physical servers. This practice of physical and logical segregation provides a far greater degree of separation than shared virtualized environments.
The core objective here is to break the authorization dependency chain, ensuring that credentials or permissions compromised elsewhere in the network cannot be leveraged to gain access to these Tier 0 systems. This design creates defense in depth security barriers, fundamentally reducing the likelihood and impact of a complete system compromise.
Conclusion
Mandiant has observed that threat actors are increasingly targeting vSphere, not just for ransomware deployment, but also as a key avenue for data exploitation and exfiltration. This shift is demonstrated by recent threat actor activity observed by GTIG, where adversaries have leveraged compromised vSphere environments to exfiltrate sensitive data such as AD databases before or alongside ransomware execution.
As this document has detailed, the widespread reliance on vSphere, coupled with often underestimated risks inherent in its integration with AD and the persistence of insecure default configurations, creates a dangerously vulnerable landscape. Threat actors are not only aware of these weaknesses but are actively exploiting them with sophisticated attacks increasingly targeting ESXi and vCenter to achieve maximum impact.
The usability and stability that make vSphere a foundational standard for on-premise and private clouds can be misleading; they do not equate to inherent security. The evolution of the threat landscape, particularly the direct targeting of the hypervisor layer which bypasses traditional endpoint defenses, necessitates a fundamental shift in how vSphere security is approached. Relying on outdated practices, backups, perimeter defenses alone, or assuming EDR on guest VMs provides sufficient protection for the underlying infrastructure creates significant security gaps and exposes an organization to severe risks.
Identity integration vulnerabilities will be exploited, therefore, organizations are strongly urged to immediately assess their vSphere environment’s AD integration status and decisively prioritize the implementation of the mitigation strategies outlined in this document. This proactive stance is crucial to effectively counter modern threats and includes:
Decoupling critical dependencies: Severing direct ESXi host integration with AD is paramount to shrinking the AD attack surface.
Modernizing authentication: Implementing robust, phishing-resistant MFA for vCenter, preferably via identity federation with modern IdPs, is no longer optional but essential.
Systematic hardening: Proactively addressing the insecure defaults for ESXi and vCenter, enabling features like execInstalledOnly, Secure Boot, TPM, Lockdown Mode, and configuring stringent firewall rules.
Enhanced visibility: Implementing comprehensive remote logging for both ESXi and vCenter, feeding into a SIEM with use cases specifically designed to detect hypervisor-level attacks.
Protecting Tier 0 assets: Strategically isolating critical workloads like Active Directory Domain Controllers in dedicated, highly secured vSphere environments with strict, minimized access controls and encrypted VMs and vMotion.
The upcoming end-of-life for vSphere 7 in October 2025 means that vast numbers of organizations will not be able to receive product support, security patches and updates for a product that underpins Infrastructure. This presents a critical juncture for organizations and a perfect storm for threat actors. The transition away from vSphere 7 should be viewed as a key opportunity to re-architect for security, not merely a routine upgrade to implement new features and obtain support. Failure to proactively address these interconnected risks by implementing these recommended mitigations will leave organizations exposed to targeted attacks that can swiftly cripple their entire virtualized infrastructure, leading to operational disruption and financial loss. The time to adopt a resilient, defense-in-depth security posture to protect these critical vSphere environments is unequivocally now.
In mid 2025, Google Threat Intelligence Group (GITG) identified a sophisticated and aggressive cyber campaign targeting multiple industries, including retail, airline, and insurance. This was the work of UNC3944, a financially motivated threat group that has exhibited overlaps with public reporting of “0ktapus,” “Octo Tempest,” and “Scattered Spider.” Following public alerts from the Federal Bureau of Investigation (FBI), the group’s targeting became clear. GTIG observed that the group was suspected of turning its ransomware and extortion operations to the U.S. retail sector. The campaign soon broadened further, with airline and transportation organizations in North America having also become targets.
The group’s core tactics have remained consistent and do not rely on software exploits. Instead, they use a proven playbook centered on phone calls to an IT help desk. The actors are aggressive, creative, and particularly skilled at using social engineering to bypass even mature security programs. Their attacks are not opportunistic but are precise, campaign-driven operations aimed at an organization’s most critical systems and data.
Their strategy is rooted in a “living-off-the-land” (LoTL) approach. After using social engineering to compromise one or more user accounts, they manipulate trusted administrative systems and use their control of Active Directory as a launchpad to pivot to the vSphere vSphere environment thus providing an avenue to exfiltrate data and deploy ransomware directly from the hypervisor. This method is highly effective as it generates few traditional indicators of compromise (IoCs) and bypasses security tools like endpoint detection and response (EDR), which often have limited or no visibility into the ESXi hypervisor and vCenter Server Appliance (VCSA).
Before discussing key detection signals and hardening strategies related to UNC3944’s vSphere-related operations, it’s important to understand vSphere logging and the distinction between vCenter Events and ESXi host logs. When forwarded to a central syslog server, vCenter Server events and ESXi host logs represent two distinct yet complementary sources of data. Their fundamental difference lies in their scope, origin, and the structured, event-driven nature of vCenter logs versus the verbose, file-based output of ESXi.
1. vCenter Server (VC Events)
vCenter events operate at the management plane, providing a structured audit trail of administrative actions and automated processes across the entire virtual environment. Each event is a discrete, well-defined object identified by a unique eventTypeId, such as VmPoweredOnEvent or UserLoginSessionEvent. This programmatic identification makes them ideal for ingestion into Security Information and Event Management (SIEM) platforms like Splunk or Google Chronicle for automated parsing, alerting, and security analysis.
Figure 1: VC Event log structure
Native storage & syslog forwarding: These events are generated by vCenter Server and stored within its internal VCSA database (PostgreSQL). When forwarded, vCenter streams a real-time copy of these structured events to the syslog server. The resulting log message typically contains the formal eventTypeId along with its human-readable description, allowing for precise analysis.
Primary use cases:
Security auditing & forensics: Tracking user actions, permission changes, and authentication
Change management: Providing a definitive record of all configuration changes to clusters, hosts, and virtual machines (VMs)
Automated alerting: Triggering alerts in a SIEM or monitoring tool based on specific eventTypeIds (e.g., HostCnxFailedEvent)
Examples of vCenter EventsAs documented in resources like thevCenter Event Mapping repository, each event has a specific programmatic identifier.
UserLoginSessionEvent
Description: “User {userName}@{ipAddress} logged in as {locale}”
Significance: A critical security event for tracking all user access to the vCenter management plane
VmCreatedEvent
Description: “Created virtual machine {vm.name} on {host.name} in {datacenter.name}”
Significance: Logs the creation of new inventory objects, essential for asset management and change control
VmPoweredOffEvent
Description: “Virtual machine {vm.name} on {host.name} in {datacenter.name} is powered off”
Significance: Tracks the operational state and availability of workloads. An unexpected power-off event is a key indicator for troubleshooting.
Note on VCSA Logging Limitations: The VCSA does not, out-of-the-box, support forwarding critical security logs for denied network connections or shell command activity. To enable this non-default capability, a custom configuration at the native Photon OS level is required. This is an agentless approach that leverages only built-in Linux tools (like iptables and logger) and does not install any third-party software. This configuration pipes firewall and shell events into the VCSA’s standard rsyslog service, allowing the built-in remote logging mechanism to forward them to a central SIEM.
2. ESXi Host Logs
ESXi logs operate at the hypervisor level, providing granular, host-specific operational data. They contain detailed diagnostic information about the kernel, hardware, storage, networking, and services running directly on the ESXi host.
Native storage: These logs are enabled by default and stored as a collection of plain text files on the ESXi host itself, primarily within the /var/log/ directory. This storage is often a local disk or a persistent scratch partition. If a persistent location is not configured, these logs are ephemeral and will be lost upon reboot, making syslog forwarding essential for forensics.
Figure 2: ESXi standard log structure
Primary use cases:
Deep-dive troubleshooting of performance issues
Diagnosing hardware failures or driver issues
Analyzing storage and network connectivity problems
Examples of ESXi log entries sent to syslog:
(from vmkernel.log): Detailed logs about storage device latency
(from hostd.log): Logs from the host agent, including API calls, VM state changes initiated on the host, and host service activity
(fromauth.log): Records of successful or failed login attempts directly to the host via SSH or the DCUI
3. ESXi Host Audit Logs
ESXi audit records provide a high-fidelity, security-focused log of actions performed directly on an ESXi host. The following analysis of the provided example demonstrates why this log source is forensically superior to standard logs for security investigations. These logs are not enabled by default.
Native storage & persistence: These records are written to audit.*.log on the host’s local filesystem, governed by the Syslog.global.auditRecord.storageEnable = TRUE parameter. Persistent storage configuration is critical to ensure this audit trail survives a reboot.
Figure 3: ESXi audit log structure
Forensic analysis: standard vs. audit log: In the provided scenario, a threat actor logs into an ESXi host, attempts to run malware, and disables the execInstalledOnly security setting. Here is how each log type captures this event:
Standard syslogshell.log analysis: The standard log provides a simple, chronological history of commands typed into the shell.
Figure 4: ESXi standard log output
Limitations:
No login context: It does not show the threat actors source IP address or that the initial SSH login was successful.
No outcome: It shows the command ./malware was typed but provides no information on whether it succeeded or failed.
Incomplete narrative: It is merely a command history, lacking the essential context needed for a full security investigation.
ESXi audit log analysis: The ESXi audit log provides a rich, structured, and verifiable record of the entire session, from connection to termination, including the outcome of each command.
Figure 5: ESXi audit log output
Successful login: It explicitly records the successful authentication, including the source IP.
Failed malware execution: This is the most critical distinction. The audit log shows that the malware execution failed with an exit status of 126.
Successful security disablement: It then confirms that the command to disable a key security feature was successful.
This side-by-side comparison proves that while standard ESXi logs show a threat actor’s intent, the ESXi audit log reveals the actual outcome, providing actionable intelligence and a definitive forensic trail. A comprehensive logging strategy for a vSphere environment requires the collection and analysis of three distinct yet complementary data sources. When forwarded to a central syslog server, vCenter Server events, ESXi host audit records, and standard ESXi operational logs provide a multilayered view of the environment’s security, administrative changes, and operational health.
Characteristic
vCenter Server Events
ESXi Audit Logs
ESXi Standard Logs
Scope
Virtual Center, ESXI
ESXi
ESXi
Enabled by Default
Yes
No
Yes
Format
Structured Objects (eventTypeId)
Verbose, Structured Audit Entries
Unstructured/Semi-structured Text
Type
Administrative, Management, Audit
Security Audit, Kernel-level Actions
Management, System-Level State
Primary Storage
VCSA Internal Database
Local Filesystem (audit.log)
Local Filesystem (/var/log/)
Primary Use Case
Central Auditing, Full Cluster Management, Forensics
Direct Host Forensics, Compliance
Deep Troubleshooting, Diagnostics
Table 1: Comparison of ESXi Logs and vCenter Events
Anatomy of an Attack: The Playbook
UNC3944’s attack unfolds across five distinct phases, moving methodically from a low-level foothold to complete hypervisor control.
Figure 6: Typical UNC3944 attack chain
Phase 1: Initial Compromise, Recon, and Escalation
This initial phase hinges on exploiting the human element.
The tactic: The threat actor initiates contact by calling the IT help desk, impersonating a regular employee. Using readily available personal information from previous data breaches and employing persuasive or intimidating social engineering techniques, they build rapport and convince an agent to reset the employee’s Active Directory password. Once they have this initial foothold, they begin a two-pronged internal reconnaissance mission:
Path A (information stores): They use their new access to scan internal SharePoint sites, network drives, and wikis. They hunt for IT documentation, support guides, org charts, and project plans that reveal high-value targets. This includes not only the names of individual Domain or vSphere administrators, but also the discovery of powerful, clearly named Active Directory security groups like “vSphere Admins” or “ESX Admins” that grant administrative rights over the virtual environment.
Path B (secrets stores): Simultaneously, they scan for access to password managers like HashiCorp Vault or other Privileged Access Management (PAM) solutions. If they find one with weak access controls, they will attempt to enumerate it for credentials.
Armed with the name of a specific, high-value administrator, they make additional calls to the help desk. This time, they impersonate the privileged user and request a password reset, allowing them to seize control of a privileged account.
Why it’s effective: This two-step process bypasses the need for technical hacking like Kerberoasting for the initial escalation. The core vulnerability is a help desk process that lacks robust, non-transferable identity verification for password resets. The threat actor is more confident and informed on the second call, making their impersonation much more likely to succeed.
Key detection signals:
[LOGS] Monitor for command-line and process execution: Implement robust command-line logging (e.g., via Audit Process Creation, Sysmon Event ID 1 or EDR). Create alerts for suspicious remote process execution, such as wsmprovhost.exe (WinRM) launching native tools like net.exe to query or modify sensitive groups (e.g., net group "ESX Admins" /add).
[LOGS] Monitor for group membership changes: Create high-priority alerts for AD Event ID 4728 (A member was added to a security-enabled global group) or 4732 (local group) for any changes to groups named “vSphere Admins,” “ESX Admins,” or similar.
[LOGS] Correlate AD password resets with help desk activity: Correlate AD Event ID 4724 (Password Reset) and the subsequent addition of a new multi-factor authentication (MFA) device with help desk ticket logs and call records.
[BEHAVIOR] Alert on anomalous file access: Alert on a single user accessing an unusually high volume of disparate files or SharePoint sites, which is a strong indicator of the reconnaissance seen during UNC3944 activity.
[CRITICAL BEHAVIOR] Monitor Tier 0 account activity: Any password reset on a Tier 0 account (Domain Admin, Enterprise Admin, vSphere) must be treated as a critical incident until proven otherwise.
Critical hardening and mitigation:
[CRITICAL] Prohibit phone-based resets for privileged accounts: For all Tier 0 accounts, enforce a strict “no password resets over the phone” policy. These actions must require an in-person, multipart, or high-assurance identity verification process.
Protect and monitor privileged AD groups: Treat these groups as Tier 0 assets: tightly control who can modify their membership and implement the high-fidelity alerting for any membership change (AD Event ID 4728/4732). This is critical as threat actors will use native tools like net.exe, often via remote protocols like WinRM, to perform this manipulation. Avoid using obvious, non-obfuscated names like “vSphere Admins” for security groups that grant high-level privileges
Harden information stores: Implement data loss prevention (DLP) and data classification to identify and lock down sensitive IT documentation that could reveal high-value targets. Treat secrets vaults as Tier 0 assets with strict, least-privilege access policies.
Restrict or monitor remote management tools: Limit the use of remote management protocols like WinRM and vSphere management APIs to authorized administrative subnets and dedicated PAWs. Log all remote commands for review and anomaly detection.
Table 2 displays threat actors actions in support of Active Directory escalation along with process and command-line data that an organization may use to detect this activity.
Process Name
Command Line
Tactic
Threat Actor’s Goal
explorer.EXE
“C:Program Files…WORDPAD.EXE” “10.100.20.55c$Usersj.doe…ACME Power DivisionDocumentsProcedure for Deploying ESXi…docx”
Reconnaissance
Threat actor, using a compromised user account, opens IT procedure documents to understand the vSphere environment and find target names.
Threat actor continues recon, opening files on a management server that likely contain names of systems, groups, or administrators.
wsmprovhost.exe
“C:…net.exe” group “ESX Admins”
Enumeration
Having found the group name, the threat actors use WinRM to remotely query the membership of the “ESX Admins” group to identify targets.
wsmprovhost.exe
“C:…net.exe” group “ESX Admins” ACME-CORPtemp-adm-bkdr /add
Manipulation
This is the key attack. The threat actor adds their controlled account (temp-adm-bkdr) to the “ESX Admins” group, granting it full admin rights to vSphere.
wsmprovhost.exe
“C:…net.exe” group “ESX Admins”
Verification
The threat actor queries the group again immediately after the modification to confirm that their malicious user was successfully added.
Table 2: Active Directory user escalation
Phase 2: The Pivot to vCenter — The Control Plane Compromise
With mapped Active Directory to vSphere credentials, the threat actors turn their sights on the heart of the virtual environment.
The tactic: They use the compromised credentials to log into the vSphere vCenter Server GUI. From there, they leverage their vCenter Admin rights to gain what amounts to “virtual physical access” to the VCSA itself. They open a remote console, reboot the appliance, and edit the GRUB bootloader to start with a root shell (init=/bin/bash), giving them passwordless root access. They then change the root password to enable SSH access upon reboot. To maintain their foothold, they upload and execute teleport, a legitimate open source remote access tool, to create a persistent and encrypted reverse shell (C2 channel) that bypasses most firewall egress rules.
Why it’s effective: vCenter’s delegation of trust in Active Directory often via LDAP(S) means the initial login isn’t protected by MFA. The VCSA takeover abuses a fundamental privilege of a virtual environment administrator—the ability to interact with a VM’s console pre-boot.
Key detection signals:
[LOGS] Monitor vCenter events for logins (com.vSphere.vc.UserLoginSessionLoginSuccessEvent) (com.vSphere.vc.UserLoginSessionLoginFailureEvent) and reboot (com.vSphere.vc.appliance.ApplianceRebootEvent).
[LOGS] Monitor for log entries with prefixes like “SSH” in remote VCSA syslog to detect dropped SSH attempts or other blocked traffic via iptables.
[LOGS] On the VCSA, monitor journald and implement VCSA remote forwarding of logs to a SIEM to detect unauthorized shell access and the enablement of the SSH and Shell service.
Figure 7: Remote syslog events for enablement of VCSA SSH service
[NETWORK] Use Network Flow Logs to spot anomalous outbound connections from the VCSA’s IP address.
[NETWORK] Unusual DNS Requests from vCenter – This detection identifies when a vSphere vCenter server makes DNS requests for domains that are not on the explicit allow list of known, trusted sites (e.g., vSphere.com, ntp.org, or internal domains).
[LOGS] Use of cURL or Wget to download tools: This detection can identify the use of command-line utilities like cURL or Wget on a critical server (such as a vCenter, Domain Controller, or database server) to download a file from an external URL.
Critical hardening and mitigation:
[CRITICAL] Enable the VCSA remote logging: Implementremote syslog forwarding on the VCSA appliance.
[CRITICAL] Enforce phishing-resistant MFA on vCenter: Implement a phishing-resistant MFA solution, such as FIDO2/WebAuthn, for all vCenter logins by federating authentication with a supported identity provider. This is a critical control that directly neutralizes the threat of credential theft, rendering phishing attacks against vCenter users ineffective.
[CRITICAL] Enforce least privilege in vCenter: Strictly limit the use of the Administrator role, reserving it for dedicated “break glass” accounts only such as administrator@vsphere.local. Instead, create granular, custom roles for specific job functions to ensure users and groups only have the minimum permissions necessary, breaking the link between a compromised AD account and a full vCenter takeover.
[CRITICAL] Use the VCSA firewall and block shell access: Block all unnecessary outbound internet traffic from the VCSA using egress filtering and its built-in firewall. Disable the SSH and BASH shells by default. This thwarts the teleport backdoor and makes the VCSA takeover significantly more difficult.
[CRITICAL]Configure the VCSA’s underlying iptables firewall: Enforce a Zero Trust allow-list for all management interfaces (443, 5480, 22) and enable logging for all denied connections. The default VCSA GUI firewall can be disabled by an attacker with a compromised web session and, crucially, it does not log blocked connection attempts. By configuring iptables at the OS level, the rules become immune to GUI tampering, and every denied connection is logged and forwarded to your SIEM.
Table 3 displays threat actor actions in support of Teleport Installation along with key evidence that an organization may use to detect this activity.
The threat actor executes the installer via sudo. The script’s first action is to confirm it has the root permissions required for system-wide installation.
Define Installation Parameters
SCRIPT_NAME="teleport-installer"
TELEPORT_BINARY_DIR="/usr/local/bin"
TELEPORT_CONFIG_PATH="/etc/teleport.yaml"
The script defines its core parameters, including where the backdoor’s binaries and configuration files will be placed on the compromised VCSA’s filesystem.
Hardcode C2 & Authentication Details
TARGET_HOSTNAME='c2.attacker.net'
JOIN_TOKEN='[REDACTED_JOIN_TOKEN]'
CA_PIN_HASHES='sha256:[REDACTED_CA_PIN_HASH]
The threat actor embeds the unique, pre-generated credentials required for the agent to connect and authenticate to their external command-and-control (C2) server
Detect OS & Select Package Type
if [[ ${f} != "tarball"
&& ${f} != "deb" ...
The script contains logic to detect the underlying operating system (e.g., Debian, RHEL, or a generic Linux like the VCSA) to ensure it uses the correct installation package (.deb, .rpm, or .tar.gz).
Download & Install Binaries
Script logic proceeds to download the ‘tarball’ package and unpacks binaries to /usr/local/bin
Based on the OS detection, the script would then download the appropriate Teleport package from an threat actor-controlled source and install the binaries (teleport, tsh, tctl) into the predefined directory.
[Implied Action] Script creates and enables a systemd unit file
To ensure the backdoor survives reboots, the script creates a systemd service file using the defined path. It then enables and starts the teleport service, which initiates the final, persistent connection to the C2 server.
Table 3: VCSA Teleport installation
Phase 3: The Hypervisor Heist — Offline Credential Theft and Exfiltration
This is where the threat actor leverages their vSphere control to operate beneath the notice of in-guest security and EDR.
The tactic: From vCenter, the threat actor enables SSH on the ESXi hosts and reset their root passwords. They then execute an offline attack by identifying a Domain Controller VM, powering it off, and detaching its virtual disk (.vmdk). This disk is then attached as a secondary drive to a forgotten or “orphaned” VM they control. From this unmonitored machine, they copy the NTDS.dit Active Directory database. The process is then reversed, and the DC is powered back on as if nothing happened. The stolen data is then moved in a two-stage process: first, an internal transfer from the orphaned VM to the compromised VCSA using sftp, and second, an external exfiltration from the VCSA through the already-established teleport C2 channel to a threat actor controlled cloud service.
Why it’s effective: This entire operation occurs at the hypervisor layer, making it invisible to any EDR or security agent running inside the Domain Controller’s operating system. The use of the VCSA as a data funnel bypasses any network segmentation rules.
Table 4 displays threat actor actions in support of VM data exfiltration along with key evidence that an organization may use to detect this activity.
Tactic
Evidence Source
Key Evidence
Threat Actor’s Goal
Identify Target VM
Browser History
URL: https://vcsa-prod-01.acme.local/ui/...
Page Title: vSphere – ACME-DC01 – Datastores
The threat actor, logged in as a compromised user , browses the vSphere UI to locate the virtual machine for the target Domain Controller (ACME-DC01).
Identify Staging VM
Browser History
URL: https://vcsa-prod-01.acme.local/ui/...
Page Title: vSphere – OLD-APPSRV-01 – Networks
The threat actor identifies a seemingly abandoned server (OLD-APPSRV-01) to use as their staging VM, onto which they will mount the DC’s disk.
Execute Disk Swap
vCenter Event Log
Event: [vim.event.VmReconfiguredEvent]
User: ACMEthreat.actor
Action: Reconfigured OLD-APPSRV-01 on esxi-prod-02.acme.local
The threat actor triggers a VM reconfiguration on the staging VM. This is the start of the disk attachment process.
The log shows a disk device being modified on the staging VM. The source file path clearly shows that the virtual disk (.vmdk) belonging to the Domain Controller (ACME-DC01) is being attached.
Simultaneously, the ESXi host logs the ReconfigVM_Task being executed against the staging VM, confirming the action was carried out at the hypervisor level.
Table 4: Virtual machine data exfiltration
Key detection signals:
[BEHAVIOR] Monitor for reconnaissance in the vSphere UI: Before the attack, the threat actor browses the vSphere client to identify their target (e.g., a VM named ACME-DC01) and their staging VM (OLD-APPSRV-01). If UI access logs or browser histories from admin workstations are available, correlating suspicious browsing patterns with a subsequent reconfiguration event can provide very early warning.
[LOGS] Scrutinize: As shown in this anonymised real-world example, a vim.event.VmReconfiguredEvent for the staging VM (e.g., OLD-APPSRV-01) will contain the file path of the target VM’s disk in its configuration details (e.g., backing = (fileName = '.../ACME-DC01/ACME-DC01_4.vmdk' ...)). Create high-priority alerts that parse this event data to detect when a disk from a critical asset is attached to any non-standard machine.
[LOGS] Correlate the full event sequence: A high-fidelity alert can be built by correlating the full sequence of vCenter events on a critical asset: VmPoweredOffEvent, followed by the VmReconfiguredEvent previously detailed, and eventually a VmPoweredOnEvent combined with a restart initiated by vmtoolsd.exe, along with supporting Windows guest events like 6006 (shutdown) and 6005 (startup).
[BEHAVIOR] Create CRITICAL alerts for any power-on or reconfiguration event on VMs located in a “Decommissioned” or “Orphaned” folder as these are prime candidates for the threat actors staging VM.
[LOGS] Monitor ESXi host changes: Alert on SSH service start via vCenter events (vim.event.HostServiceStartedEvent), firewall configuration changes (vim.event.HostFirewallInfoChangedEvent), and direct root shell access logs on the ESXi hosts themselves.
Critical hardening and mitigation:
[CRITICAL] Use vSphere VM encryption: Encrypt all Tier 0 virtualized assets. This is the definitive technical block for the offline “Disk Swap” attack as the stolen .vmdk file would be unreadable.
[CRITICAL] Implement a strict VM decommissioning process: Formally decommission old VMs by deleting their disks. Do not leave powered-off, “orphaned” VMs on your datastores as these are the ideal workbenches for threat actors.
[CRITICAL] Harden ESXi accounts: Disable the default ESXi root account in favor of a named “break glass” account with a highly complex password. On ESXi 8.0+, run esxcli system account set -i vpxuser -s false to prevent a compromised vCenter user from changing ESXi root passwords.
[CRITICAL] Enable ESXi remote audit logging: Enable remote ESXi audit logging (vpxa.log, hostd.log, audit_records) to a SIEM to provide verbose, centralized details of security-focused events on the hosts themselves.
Figure 8: Remote syslog events for SSH access to ESXi
Phase 4: Backup Sabotage — Removing the Safety Net
Before deploying ransomware, the actor ensures their target cannot recover.
The tactic: Leveraging their full control over Active Directory, the threat actor targets the backup infrastructure (e.g., a virtualized backup server). They either reuse the compromised Domain Admin credentials to log in via RDP or, more stealthily, add a user they control to the “Veeam Administrators” security group in AD. Once in, they delete all backup jobs, snapshots, and repositories.
Why it’s effective: This works due to a lack of administrative tiering (where the same powerful accounts manage both virtualization and backups) and insufficient monitoring of changes to critical AD security groups.
Key detection signals:
[Detecting Path A] Monitor for interactive logons (Windows Event ID 4624) on the backup server by high-privilege accounts.
[Detecting Path B] Triggers a CRITICAL alert from AD logs for Event ID 4728 (“A member was added to a security-enabled global group”) for any change to the “Veeam Administrators” group
[LOGS] Monitor the backup application’s own audit logs for mass deletion events.
Critical hardening and mitigation:
[CRITICAL] Isolate backup infrastructure: The Veeam server and its repositories must be in a separate MFA protected, highly restricted security domain or use dedicated, non-AD-joined credentials. This severs the AD trust relationship the threat actor exploits.
[CRITICAL] Utilize immutable repositories: This is the technical backstop against backup deletion. It makes the backup data undeletable for a set period, even if a threat actor gains full administrative access to the backup console.
Phase 5: Encryption — Ransomware from the Hypervisor
With the target blinded and their safety net gone, the final stage commences.
The tactic: The threat actor uses their SSH access to the ESXi hosts to push their custom ransomware binary via SCP/SFTP into a writable directory like /tmp. They then execute a script that uses the native ESXi command-line tool, vim-cmd, to forcibly power off every VM on the host. Finally, they launch the ransomware binary (often with nohup to ensure it continues after they log out), which scans the datastores and encrypts all VM files (.vmdk, .vmx, etc.).
Table 5 displays threat actor actions in support of ESXi ransomware execution along with key evidence that an organization may use to detect this activity.
Tactic
Source Log File
Key Evidence
Threat Actor’s Goal
SSH Login
/var/log/auth.log
SSH session was opened for 'root@10.10.10.5'
The Threat Actor logs in as root to the compromised ESXi host via an interactive SSH session.
Prepare Payload
/var/log/shell.log
chmod 0777 encrypt.out
cp encrypt.out encrypt_.out
The Threat Actor’s commands to make the ransomware payload executable are captured by the ESXi shell log.
Create Exclusion List
/var/log/shell.log
echo VCSA-01-PROD >> list.txt
echo DC-01-PASSIVE >> list.txt
The shell log records the creation of the list.txt file, revealing the threat actors intent to selectively encrypt systems.
The exact command to launch the time-delayed ransomware, including the key and exclusion list, is logged. The nohup command ensures it runs after they log out.
Clean Up & Exit
/var/log/shell.log
ls nohup.out
exit
The threat actors final commands and session termination are recorded before they exit, leaving the payload to run.
Table 5: ESXi ransomware execution
Why it’s effective: Root access on the ESXi shell is the highest level privilege in a virtual environment. By encrypting at the hypervisor level, they bypass all in-guest security and compromise servers with a single action.
Key detection signals:
[NETWORK] Monitor Network Flow Logs for large file transfers to and from ESXi hosts over SSH/SCP.
[BEHAVIOR] A SIEM alert for a high volume of VM power-off commands originating from a single ESXi host is a high-fidelity indicator of an ongoing attack.
[LOGS] Monitor ESXi host logs for the execution of esxcli system settings kernel set -s execInstalledOnly -v FALSE (a threat actor attempting to disable a key defense) and mass vmsvc/power.off commands. Since this setting only applies after a reboot, correlate this alert with a subsequent host reboot within a short time window.
Critical hardening and mitigation:
[CRITICAL] Enable vSphere lockdown mode: This is a primary prevention for this phase as it blocks the interactive SSH access needed to push and execute the payload.
[CRITICAL] Enforce execInstalledOnly execution policy: This ESXi kernel setting is the definitive technical prevention. It blocks any unsigned binary from running, rendering the threat actor’s custom ransomware execution attempt to failure. Enable the hardware based TPM 2.0 chip with Secure Boot to lock this setting so it cannot be disabled.
The Three-Pillar Defense: A Fortified Strategy
Pillar 1: Proactive Hardening (Your Most Reliable Defense)
Architect for centralized access: Do not join ESXi hosts directly to Active Directory. Manage all host access exclusively through vCenter roles and permissions. This drastically reduces the attack surface.
Enable vSphere lockdown mode: This is a critical control that restricts ESXi management, blocking direct shell access via SSH and preventing changes from being made outside of vCenter.
Enforce execInstalledOnly: This powerful ESXi kernel setting prevents the execution of any binary that wasn’t installed as part of a signed, packaged vSphere Installation Bundle (VIB). It would have directly blocked the threat actor’s custom ransomware from running.
Use vSphere VM encryption: Encrypt your Tier 0 virtualized assets (DCs, PKI, etc.). This is the definitive technical block for the offline disk-swap attack, rendering any stolen disk files unreadable.
Practice strict infrastructure hygiene: Don’t just power off old VMs. Implement a strict decommissioning process that deletes their disks from the datastore or moves them to segregated archival storage to eliminate potential “staging” machines.
Posture management: It is vital to implement continuous vSphere posture Management (CPM) because hardening is not a one-time task, but a security state that must be constantly maintained against “configuration drift.” The UNC3944 playbook fundamentally relies on creating these policy deviations—such as enabling SSH or altering firewall rules. This can be achieved either through dedicated Hybrid Cloud Security Posture Management (CSPM) tools, such as the vSphere Aria Operations Compliance Pack, Wiz, or by developing custom in-house scripts that leverage the vSphere API via PowerShell/PowerCLI to regularly audit your environment.
Harden the help desk: For privileged accounts, mandate that MFA enrollment or password resets require an in-person, multipart, or high-assurance multi-factor verification process.
Pillar 2: Identity and Architectural Integrity (Breaking the Attack Chain)
Enforce phishing-resistant MFA everywhere: This must be applied to VPN, vCenter logins, and all privileged AD accounts. Use hardened PAWs with exclusive, firewalled access to the virtual center.
Isolate critical identity infrastructure: Run your Tier 0 assets (Domain Controllers, PAM, Veeam etc) in a dedicated, highly-secured “identity cluster” with its own stringent access policies, segregated from general-purpose workloads.
Avoid authentication loops: A critical architectural flaw is hosting identity providers (AD) recovery systems (Veeam) or privileged access management (PAM) on the very virtualization platform they secure and authenticate. A compromise of the underlying ESXi hosts results in a correlated failure of both the dependent services and the means to restore them, a scenario that significantly complicates or prevents disaster recovery.
Consider alternate identity providers (IdPs): To break the “AD-to-everything” chain, consider using a separate, cloud-native IdP like Azure Entra ID for authenticating to infrastructure.
Pillar 3: Advanced Detection and Recovery (Your Safety Net)
Build detections after hardening: The most effective alerts are those that detect the attempted manipulation of the hardening controls you’ve put in place. Harden first, then build your detection logic.
Centralize and monitor key logs: Forward all logs from AD, vCenter, ESXi, networking infrastructure, firewalls, and backups to a SIEM. Correlate logs from these disparate sources to create high-fidelity detection scenarios that can spot the threat actors’ methodical movements.
Focus on high-fidelity alerts: Prioritize alerting on events in phases 1-3. Detecting the enablement of SSH on a host, a VCSA takeover, or membership changes to your “Veeam Admins” group will enable you to act before data exfiltration and ransomware deployment.
Architect for survival: Assume the worst-case scenario. Your immutable and air-gapped backups are your last line of defense. They must be isolated from your production AD and inaccessible to a compromised administrator. Test your recovery plan against this specific threat model to ensure it works.
Conclusion: The Defender’s Mandate — Harden and Alert
UNC3944’s playbook requires a fundamental shift in defensive strategy, moving from EDR-based threat hunting to proactive, infrastructure-centric defense. This threat differs from traditional Windows ransomware in two ways: speed and stealth. While traditional actors may have a dwell time of days or even weeks for reconnaissance, UNC3944 operates with extreme velocity; the entire attack chain from initial access to data exfiltration and final ransomware deployment can occur in mere hours. This combination of speed and minimal forensic evidence makes it essential to not just identify but to immediately intercept suspicious behavioral patterns before they can escalate into a full-blown compromise.
This living-off-the-land (LotL) approach is so effective because the Virtual Center appliance and ESXi hypervisor cannot run traditional EDR agents, leaving a significant visibility gap at the virtualization layer. Consequently, sophisticated detection engineering within your SIEM becomes the primary and most essential method for active defense.
This reality presents the most vital key for defenders: the ability to detect and act on early alerting is paramount. An alert generated during the final ransomware execution is merely a notification of a successful takeover. In contrast, an alert that triggers when the threat actor first compromises a help desk account or accesses Virtual Center from an unusual location is an actionable starting point for an investigation—a crucial window of opportunity to evict the threat before they achieve complete administrative control.
A resilient defense, therefore, cannot rely on sifting through a sea of broad, noisy alerts. This reactive approach is particularly ineffective when, as is often the case, many vSphere environments are built upon a foundation of insecure defaults—such as overly permissive roles or enabled SSH—and suffer from a lack of centralized logging visibility from ESXi hosts and vCenter. Without the proper context from these systems, a security team is left blind to the threat actors’ methodical, LotL movements until it is far too late.
Instead, the strategy must be twofold. First, it requires proactive, defense-in-depth technical hardening to systematically correct these foundational gaps and reduce the attack surface. Second, this must be complemented by a deep analysis of the threat actor’s tactics, techniques, and procedures (TTPs) to build the high-fidelity correlation rules and logging infrastructure needed to spot their earliest movements. This means moving beyond single-event alerts and creating rules that connect the dots between a help desk ticket, a password reset in Active Directory, and a subsequent anomalous login to vCenter.
These two strategies are symbiotic, creating a system where defense enables detection. Robust hardening is not just a barrier, it also creates friction for the threat actor, forcing them to attempt actions that are inherently suspicious. For example, when Lockdown Mode is enabled (hardening), a threat actor’s attempt to open an SSH session to an ESXi host will fail, but it will also generate a specific, high-priority event. The control itself creates the clean signal that a properly configured SIEM is built to catch.
For any organization with a critical dependency on vSphere, this is not a theoretical exercise. What makes this threat exceptionally dangerous is its ability to render entire security strategies irrelevant. It circumvents traditional tiering models by attacking the underlying hypervisor that hosts all of your virtualized Tier 0 assets—including Domain Controllers, Certificate Authorities, and PAM solutions—rendering the logical separation of tiering completely ineffective. Simultaneously, By manipulating virtual disks while the VMs are offline, it subverts in-guest security solutions—such as EDR, antivirus (AV), DLP, and host-based intrusion prevention systems (HIPS)—as their agents cannot monitor for direct ESXi level changes.
The threat is immediate, and the attack chain is proven. Mandiant has observed that the successful hypervisor-level tactics leveraged by groups like UNC3944 are no longer exclusive; these same TTPs are now being actively adopted by other ransomware groups. This proliferation turns a specialized threat into a mainstream attack vector, making the time to act now.
Amazon Elastic Container Registry (ECR) now allows you specify exceptions to image tag immutability setting. You can now provide a list of tag filters to exempt certain tags from the tag immutability setting, allowing you to enforce immutability for most tags while retaining flexibility for others.
ECR image tag settings allows you to control whether repository tags can be overwritten. You may set image tags to either mutable which allows tags to be overwritten, or immutable which prevents tags from being overwritten. With ECR support for exception to tag immutability, ECR can now enforce mutability or immutability for all tags except certain tags based on the list of tag filters that you specify. For example, you can now enforce immutability for production tags while retaining flexibility for certain tags such as latest to remain mutable for development, testing, and automation workflows.
ECR’s support for exception to tag mutability and immutability is generally available in all AWS commercial and AWS GovCloud (US) Regions at no additional cost. For more details, visit our documentation.
Amazon Timestream for InfluxDB now offers 24xlarge memory-optimized instances, providing enhanced performance for demanding time-series workloads. This new instance type is generally available for both Single-AZ and Multi-AZ deployments, as well as Multi-AZ Read Replica clusters, enabling customers to scale their time-series database solutions.
The 24xlarge instance delivers 96 vCPU, 768 GiB of memory, and up to 40 Gbps of enhanced network bandwidth. This makes it ideal for large-scale, I/O-intensive time-series applications that require fast response times at scale, such as industrial telemetry, IoT analytics, and financial trading platforms.
This feature is now available in US East (Ohio), US East (N. Virginia), US West (Oregon), Asia Pacific (Mumbai), Asia Pacific (Singapore), Asia Pacific (Sydney), Asia Pacific (Tokyo), Europe (Frankfurt), Europe (Ireland), Europe (Spain), and Europe (Stockholm).
Amazon EBS io2 Block Express volumes are now available in all commercial and AWS GovCloud (US) Regions, except China regions.
io2 Block Express leverage the latest generation of EBS storage server architecture designed to deliver consistent sub-millisecond latency and 99.999% durability. With a single io2 Block Express volume, you can achieve 256,000 IOPS, 4GiB/s throughput, and 64TiB storage capacity. You can also attach an io2 Block Express volume to multiple instances in the same Availability Zone, supporting shared storage fencing through NVMe reservations for improved application availability and scalability. With the lowest p99.9 I/O latency among major cloud providers, io2 Block Express is the ideal choice for the most I/O-intensive, mission-critical deployments such as SAP HANA, Oracle, SQL Server, and IBM DB2.
Customers using io1 volumes can upgrade to io2 Block Express without any downtime using the ModifyVolume API to achieve 100x durability, consistent sub-millisecond latency, and significantly higher performance at the same or lower cost than io1. With io2 Block Express, you can drive up to 4x IOPS and 4x throughput at the same storage price as io1, and up to 50% cheaper IOPS cost for volumes over 32,000 IOPS. You can use AWS Compute Optimizer and AWS Cost Optimization Hub to recommend the optimal io2 volume performance required by your workloads, based on the io1 utilization data collected by Amazon CloudWatch.
You can create and manage io2 Block Express volumes using the AWS Management Console, the AWS CLI, or the AWS SDKs. For more information on io2 Block Express, see our product overview page.
Today, AWS Audit Manager announces it has updated 14 standard frameworks, to enhance evidence collection capabilities and help customers meet their compliance requirements while optimizing costs. This update improves evidence relevance across key frameworks like SOC 2 and PCI DSS v4.0, and enhances framework coverage for better compliance validation.
These updates will streamline number of findings for most customers and reduce associated costs. The cost reduction will depend on number of AWS resources a customer uses, the frameworks they’re assessing, and the degree of overlapping controls between these frameworks. If you are an existing Audit Manager customer and created assessments for these frameworks on or after June 6th, 2024 – no action is required to use these updated standard frameworks, if you created assessments for these frameworks prior to June 6th, 2024 – please create new assessments for these frameworks to receive the latest updates.
AWS Deadline Cloud now supports connecting resources in your Amazon Virtual Private Cloud (VPC), like shared storage or a license server, to your service-managed fleets. AWS Deadline Cloud is a fully managed service that simplifies render management for teams creating computer-generated graphics and visual effects for films, television, broadcasting, web content, and design.
Render farm workers need access to the storage locations that contain the input files necessary to process a job, and to the locations that store the output. Extending the existing capability to use S3 based storage, like the Deadline Cloud job attachments feature, resource endpoints (powered by AWS PrivateLink) make it easy to securely connect high-performant file systems, like Amazon FSx or Qumulo, to your Deadline Cloud service-managed fleets. Workers also need access to licenses to complete jobs when using licensed software and resource endpoints simplify bringing your own licenses to service-managed fleets.
AWS Client VPN is now available in two new Asia Pacific Regions: Malaysia and Thailand. This fully managed service enables customers to securely connect their remote workforce to resources in AWS or on-premises networks.
AWS Client VPN eliminates the need for hardware VPN appliances and complex operational management through its pay-as-you-go model. Organizations can easily manage and monitor VPN connections through a single console.
AWS Organizations Tag Policies announces wildcard support for Tag Policies using ALL_SUPPORTED in the Resource element. With this, you can simplify your policy authoring experience and reduce your policy size. You can now specify that your Tag Policy applies to all supported resource types for a given AWS service in a single line, instead of individually adding them to your policy.
Tag Policies enable you to enforce consistent tagging across your AWS accounts with proactive compliance, governance and control. For example, you can define a policy that all EC2 instances with “Environment” tag key must use only “Prod” or “Non-Prod” values. Previously, you had to list each EC2 resource type individually in a Tag Policy, such as instances, volumes, and snapshots. With ALL_SUPPORTED wildcard, you can now apply the same rule to all supported EC2 or S3 resource types in a single line.
You can use this feature via AWS Management Console, AWS Command Line Interface, and AWS Software Development Kit. This feature is available with AWS Organizations Tag Policies in AWS Regions where Tag Policies is available. To learn more, visit Tag Policies documentation.
AWS Identity and Access Manager (IAM) Access Analyzer now supports unused access findings, internal access findings, and custom policy checks in the AWS GovCloud (US-East and US-West) Regions to help guide you towards least privilege.
IAM Access Analyzer continuously analyzes your accounts to identify unused access and surfaces findings to highlight unused roles, unused access keys for IAM users, and unused passwords for IAM users. For active IAM roles and users, the findings provide visibility into unused services and actions. With internal access findings, you can identify who within your AWS organization has access to your Amazon S3, Amazon DynamoDB, or Amazon Relational Database Service (RDS) resources. It uses automated reasoning to evaluate all identity policies, resource policies, service control policies (SCPs), and resource control policies (RCPs) to surface all IAM users and roles that have access to your selected critical resources. After the new analyzers are enabled in the IAM console, the updated dashboard highlights your AWS accounts and resources that have the most findings and provides a breakdown of findings by type. Security teams can respond to new findings in two ways: taking immediate action to fix unintended access, or setting up automated notifications through Amazon EventBridge to engage development teams for remediation.
Custom policy checks also use the power of automated reasoning to help security teams proactively detect nonconformant updates to policies. For example, IAM policy changes that are more permissive than their previous version. Security teams can use these checks to streamline their reviews, automatically approving policies that conform with their security standards, and inspecting more deeply when they don’t.
With its exceptional price-performance, Google Cloud’s Dataproc has evolved from a simple, managed open-source software (OSS) service to a powerhouse in Apache Spark and open lakehouses, driving the analytics and AI workloads of many leading global enterprises. The recent launch of the Lightning Engine for Spark, a multi-layer optimization engine, makes Dataproc’s performance even more compelling.
But while performance is a cornerstone of the Dataproc offering, its capabilities go beyond that. To address contemporary enterprise requirements, we’ve invested in supporting open lakehouses, accelerating AI/ML workloads, fostering deeper integrations with BigQuery and Google Cloud Storage, and providing enterprise-grade security. In this post, we go into these advances, and how Dataproc is differentiated from on-premises and do-it-yourself configurations, or platforms from alternative cloud providers.
Open-source engines and open lakehouse
Whether you’re migrating from an existing on-prem data lake, cloud-based DIY clusters, or developing a multi-cloud strategy, Dataproc provides a feature-rich, and performant OSS stack, with strong compatibility and performance for open ecosystems. Some of the benefits in this regard include:
High performance: Currently in preview, the Lightning Engine Spark engine provides 3.6x better performance compared to open-source Apache Spark, thanks for traditional optimization techniques like query and execution optimizations, as well as optimizations in the file-system layer and connectors. It is fully compatible with open-source Apache Spark, and can plug into existing workloads running Dataproc on Google Compute Engine.
Optimized cost and efficiency: Native support for Spot VMs, intelligent autoscaling, and storage-aware optimizations reduce total cost of ownership. Recent enhancements to Dataproc autoscaling have shown to decrease cluster VM expenditures by up to 40% and to reduce cumulative job runtime by 10%, according to our evaluations.
Open lakehouse support: Out-of-the-box compatibility with leading open table formats, including Apache Iceberg, Delta Lake, and Apache Hudi. Dataproc offers improved lakehouse integration through catalog support, advanced optimizations, metadata caching, and comprehensive observability features.
Open Metastore integration: Support for BigLake Metastore, Iceberg Rest API compliant and Hive Metastore (HMS) compliant metastores help ensure an open and interoperable architecture. This enables you to work with your existing metastores easily, especially during migrations.
aside_block
<ListValue: [StructValue([(‘title’, ‘$300 in free credit to try Google Cloud data analytics’), (‘body’, <wagtail.rich_text.RichText object at 0x3e1edbacc940>), (‘btn_text’, ‘Start building for free’), (‘href’, ‘http://console.cloud.google.com/freetrial?redirectPath=/bigquery/’), (‘image’, None)])]>
Optimizations across the storage layers
Spark with Cloud Storage
We’ve integrated Dataproc with Cloud Storage to optimize data access patterns and reduce costs. Key improvements include:
Smarter API retries: Rate-limit aware retry mechanisms help ensure resilient and efficient data access from Cloud Storage, even during periods of high demand.
Reduced metadata overhead: Optimized connectors significantly decrease the number of metadata calls to the Cloud Storage API, providing direct cost savings. The graph below shows the metadata optimizations of the Lightning Engine with Cloud Storage compared to open-source connectors.
Intelligent caching and prefetching: To enhance data retrieval efficiency from Cloud Storage, Dataproc integrates block-level caching and sub-query fusion. Additionally, scan bottlenecks are mitigated through the implementation of vectorized scans and the proactive pre-fetching of Parquet row groups.
Spark with BigQuery
Lightning Engine offers significant advantages in accessing data in BigQuery. Some of the important ones are:
Spark in BigQuery notebooks: You can now use multiple query engines on a single copy of data. You can author and interactively execute Spark code directly in BigQuery Studio notebooks. Write Spark SQL or PySpark code in the same notebook.
Accelerated, high-throughput connectivity: The optimized BigQuery connector for Spark utilizes the BigQuery Storage API for massively parallel reads, delivering up to 4x performance improvements over previous versions. The connector also reads data directly in the Apache Arrow format, eliminating costly serialization steps.
Intelligent query pushdown: Smart filter pushdown minimizes data movement by ensuring only necessary data is sent to the Spark cluster.
Unified data discovery: By using BigLake metastore as a federated Spark metastore, BigQuery tables become instantly discoverable in your Dataproc Spark environment, creating a unified analytics experience.
The below graph shows the performance improvements of Lightning Engine with Big Query compared to the open-source Spark with BQ connector.
AI/ML features
Dataproc streamlines the path from large-scale data processing to impactful AI and machine learning outcomes, lowering the barrier to entry for onboarding AI workloads. It provides a flexible and powerful environment where data scientists can focus on model development, not infrastructure management. Key advantages include:
Zero-scale clusters: Accelerate data analysis and notebook jobs without the overhead of maintaining traditional, long-running clusters. Zero-scale clusters let you scale down your worker nodes to zero.
Library management: AI/ML engineers frequently try new libraries for AI/ML development. We introduced a simple addArtifacts method to Dataproc to dynamically add PyPI packages to your Spark session. This installs specified packages and their dependencies in the Spark environment, making them available to workers for your UDFs.
Accelerated, GPU-powered ML: Dataproc clusters can be provisioned with powerful NVIDIA GPUs. Our ML images come pre-configured with GPU drivers, Spark RAPIDS, CUDA, cuDNN, NCCL and ML libraries like XGBoost, PyTorch, tokenizers, transformers, and more to accelerate ML tasks out of the box.
A clear path to advanced AI:Dataproc’s deep integration with Vertex AI provides easy access to Google’s state-of-the-art models along with third-party and open-source models, enabling at-scale batch inference and other advanced MLOps workflows directly from Dataproc jobs.
Enterprise features and security
Dataproc is built on Google Cloud’s secure foundation and provides security and governance features designed for the most demanding enterprises.
Organization Policy/fleet management:Organization Policy offers centralized, programmatic control over resources. As an administrator, you can define policies with constraints that apply to Dataproc resources including Dataproc cluster operations, sizing and cost.
Granular access control and authentication: Dataproc integrates with Google Cloud’s Identity and Access Management (IAM). For even more fine-grained control, you can enable Kerberos for strong, centralized authentication within your cluster. Furthermore, personal authentication support allows you to configure clusters so that jobs and notebooks are run using the end user’s own credentials, enabling precise, user-level access control and auditing.
Proactive vulnerability management: We maintain a robust Common Vulnerabilities & Exposures (CVE) detection and patching process, regularly updating Dataproc images with the latest security patches. When a critical vulnerability is discovered, we release new image versions promptly, allowing you to easily recreate clusters with the patched version, minimizing vulnerability exposure.
Comprehensive audit logging and lineage: Dataproc, like all Google Cloud services, generates detailed Cloud Audit Logs for all administrative activities and data access events, providing a clear, immutable record of who did what, and when. For end-to-end governance, you can leverage Dataplex Universal Catalogto automatically discover, catalog, and track data lineage across all your data assets in Dataproc, BigQuery, and Cloud Storage, providing a holistic view for compliance and impact analysis.
Easy monitoring and AI-driven troubleshooting: Serverless Spark UI makes it easy to access all Spark metrics without requiring to set up a Persistent History Server, removing manual overhead. Google Cloud Assist uses the latest Gemini AI models to identify issues with your jobs and recommends fixes and optimizations.
Performance, plus innovation and productivity
The enhancements across performance, open-source support, tight integrations with Google services, security, and AI/ML give Dataproc a competitive advantage over other Spark offerings. By managing the underlying complexity, Dataproc allows you to focus on driving business value from data, not on solving infrastructure challenges and open-source concerns. Whether you are migrating from an on-prem Hadoop environment, DIY clusters on the cloud, building a cloud-native lakehouse, or onboarding a new AI workload, Dataproc provides the performance, security, and flexibility at competitive pricing to meet your goals.
To learn more about how Dataproc can accelerate your data strategy, explore the official documentation or contact our sales team to schedule a demo.
The best way to learn AI is by building. From finding quick ways to deploy open models to building complex, multi-agentic systems, it’s easy to feel overwhelmed by the sheer volume of resources out there.
To that end, we’ve compiled a living, curated collection of our 25+ favorite how-to guides for Google Cloud. This collection is split into four areas:
Faster model deployment: Create efficient CI/CD pipelines, deploy large models like Llama 3 on high-performance infrastructure, and use open models in Vertex AI Studio.
Building generative AI apps & multi-agentic systems: Build document summarizers, multi-turn chat apps, and advanced research agents with LangGraph.
Fine-tuning, evaluation, and Retrieval-Augmented Generation (RAG): Refine models with supervised fine-tuning, RAG, and Reinforcement Learning from Human Feedback (RLHF).
Integrations: Connect your AI to the world by building multilingual mobile chatbots or integrating with Google Cloud Databases.
Bookmark this page and check back often for our latest finds.
aside_block
<ListValue: [StructValue([(‘title’, ‘$300 in free credit to try Google Cloud AI and ML’), (‘body’, <wagtail.rich_text.RichText object at 0x3e1edc393ca0>), (‘btn_text’, ‘Start building for free’), (‘href’, ‘http://console.cloud.google.com/freetrial?redirectPath=/vertex-ai/’), (‘image’, None)])]>
Faster model deployment
1.Build a CI/CD pipeline for your ML workflow. Automate the process of building, testing, and deploying a Vertex AI Pipeline by connecting a GitHub repo to Cloud Build triggers. Github repository.
2.Deploy large models like Llama 3 on high-performance A3 VMs. This guide provides the Terraform scripts to provision an AI Hypercomputer cluster (A3 VMs with GPUs) and deploy large open models using JAX for maximum performance. GitHub provisioning documentation.
3. Access DeepSeek models and Llama 4 models on AI Hypercomputer. ThisTPU recipeoutlines the steps to deploy the Llama-4-Scout-17B-16E Model with JetStream MaxText Engine with Trillium TPU. You can deploy Llama4 Scout and Maverick models or DeepSeekV3/R1 models today using inference recipes from the AI Hypercomputer Github repository.
5. Build and deploy a remote MCP server to Google Cloud Run in under 10 minutes. Drawing directly from the officialCloud Run documentation for hosting MCP servers, this guide shows you the straightforward process of setting up your very own remote MCP server.Blog.
Building gen AI apps & multi-agentic systems
6.Create a document (text) summarizer with Gemini Pro. This Python notebook shows you how to use the Vertex AI SDK to interact with the Gemini Pro model for a practical task: generating a concise summary of a long document. Github recipe.
7. Build multi-turn chat applications with Gemini. This notebook demonstrates how to use the Gemini API to build a stateful, multi-turn chat service that can remember conversation history. Official documentation.
8. Build a multimodal research agent with LangGraph. An advanced recipe for building a true AI agent that can work in a loop. It uses LangGraph to create a workflow where the agent can search the web, analyze images from the results using Gemini, and synthesize a final answer. Sample code. Blog.
9. Get AI to write good SQL queries (text-to-SQL). Learn state-of-the-art approaches to context building and table retrieval, how to do effective evaluation of text-to-SQL quality with LLM-as-a-judge techniques, the best approaches to LLM prompting and post-processing, and how we approach techniques that allow the system to offer virtually certified correct answers. Guide.
11. Build a simple multi-agent system using ADK – in this case, a trip planning system. Exploreproject source code.
12. Build an interactive data anonymizer agent using Google’s ADK. The agent interactively analyzes a table’s schema and data to identify sensitive columns, then proposes and generates a ready-to-run SQL script to create an anonymized and sampled copy. Explore project sample code.
13. Build a strong brand logo with Imagen 3 and Gemini. Learn how you can build your brand style with a logo using Imagen 3, Gemini, and the Python Library Pillow. Sample code.
Fine-tuning, evaluation, and RAG
14. The ultimate best practices guide for Supervised Fine Tuning with Gemini. This guide takes you deeper into how developers can streamline their SFT process, including: selecting the optimal model version, crafting a high quality dataset, and best practices to evaluate the models, including tools to diagnose and overcome problems. Full guide. Gen AI repo.
15. The ultimate guide for getting started with Vertex AI RAG. Bookmark the top concepts for understanding Vertex AI RAG Engine. These concepts are listed in the order of the retrieval-augmented generation (RAG) process.Getting started notebook.
16. Design a production-ready RAG system. A comprehensive architecture guide for understanding the end-to-end role of Vertex AI and Vector Search in a generative AI app. It includes system diagrams, design considerations, and best practices. Official architecture guide.
17. Advanced RAG Techniques: Vertex RAG Engine retrieval quality evaluation and hyperparameters tuning. Learn how to evaluate and perform hyperparameter tuning for retrieval with RAG Engine. Github repo.
18. Fine-tune models using reinforcement learning (RLHF). This tutorial demonstrates how to use reinforcement learning from human feedback (RLHF) on Vertex AI to tune a large-language model (LLM). This workflow uses feedback gathered from humans to improve a model’s accuracy. Colab.
19. Fine-tune video inputs on Vertex AI. If your work involves content moderation, video captioning, and detailed event localization, this guide is for you.Sample notebook.
20. Rapidly compare text prompts and models during development. Use this “Rapid Evaluation” SDK to quickly compare the outputs of different text-based prompts or models side-by-side. Colab.
21. Get feature attributions with Explainable AI. For classification and regression models, know why a model made a certain prediction using Vertex Explainable AI. Documentation.
22. Optimize your RAG retrieval. Step-by-step ways to minimize hallucinations and build trust in AI applications, from root cause analysis to creating a testing framework. Blog.
Integrations
23. Build a multilingual chatbot for mobile. A complete end-to-end guide for building a multilingual chatbot on Android. It combines Gemma, the Gemini API, and MCP to create a powerful, global-ready application. Github repo. Blog.
24. Develop ADK agents that connect to external MCP servers. Use this example of an ADK agent leveraging MCP to access Wikipedia articles, which is a common use case to retrieve external specialised data. We will also introduce Streamable HTTP, the next-generation transport protocol designed to succeed SSE for MCP communications. Guide.
25. Encode text embeddings using the Vertex AI embeddings for text service and the StackOverflow dataset. Vector Search is a fully managed offering, further reducing operational overhead. It’s built upon Approximate Nearest Neighbor (ANN) technology developed by Google Research. Notebook.
26. Integrate MCP with Google Cloud Databases. Learn how to integrate any MCP-compatible AI assistant (including Claude Code, Cursor, Windsurf, Cline, and many more) with Google Cloud Databases. The blog walks you through how to write application code that queries your database, design a schema for a new application, refactor code when the data model changes, generate data for integration testing, etc. Blog.
Amazon MQ now supports Graviton3 based M7g instances for RabbitMQ in all available regions across both single instance and highly available Multi-AZ cluster deployment modes. Amazon MQ for RabbitMQ cluster brokers running on M7g instances deliver up to 50% higher workload capacity and up to 85% throughput improvements over comparable Amazon MQ for RabbitMQ cluster brokers running on M5 instances.
Amazon MQ M7g instances are powered by Arm-based AWS Graviton3 processors and are available in a wide range of sizes ranging from M7g.medium recommended for evaluation workloads, and M7g.large to M7g.16xlarge recommended for production workloads. Amazon MQ M7g clusters are provisioned with optimized Amazon EBS disk volumes that vary with the instance size and provide reduction in data storage costs for customers running RabbitMQ workloads on Amazon MQ M5 clusters. Amazon MQ M7g single instance brokers are provisioned with Amazon EBS disk volumes of 200 GB. Refer to Amazon MQ instance types supported to understand the sizes available. You can upgrade your existing RabbitMQ broker from M5 to M7g in-place.
M7g instances on Amazon MQ are available today across all generally available regions except Africa (Cape Town), Canada West (Calgary), and Europe (Milan) regions. For information on pricing and regional availability of instance sizes, refer to the Amazon MQ pricing page. . To get started, create a new RabbitMQ broker with M7g instances or upgrade your existing broker now.
Starting today, Amazon Elastic Compute Cloud (Amazon EC2) C6in instances are available in AWS Region Canada West (Calgary). These sixth-generation network optimized instances, powered by 3rd Generation Intel Xeon Scalable processors and built on the AWS Nitro System, deliver up to 200Gbps network bandwidth, for 2x more network bandwidth over comparable fifth-generation instances.
Customers can use C6in instances to scale the performance of applications such as network virtual appliances (firewalls, virtual routers, load balancers), Telco 5G User Plane Function (UPF), data analytics, high performance computing (HPC), and CPU based AI/ML workloads. C6in instances are available in 10 different sizes with up to 128 vCPUs, including bare metal size. Amazon EC2 sixth-generation x86-based network optimized EC2 instances deliver up to 100Gbps of Amazon Elastic Block Store (Amazon EBS) bandwidth, and up to 400K IOPS. C6in instances offer Elastic Fabric Adapter (EFA) networking support on 32xlarge and metal sizes.
C6in instances are available in these AWS Regions: US East (Ohio, N. Virginia), US West (N. California, Oregon), Europe (Frankfurt, Ireland, London, Milan, Paris, Spain, Stockholm, Zurich), Middle East (Bahrain, UAE), Israel (Tel Aviv), Asia Pacific (Hong Kong, Hyderabad, Jakarta, Malaysia, Melbourne, Mumbai, Osaka, Seoul, Singapore, Sydney, Tokyo), Africa (Cape Town), South America (Sao Paulo), Canada (Central), Canada West (Calgary), and AWS GovCloud (US-West, US-East). To learn more, see the Amazon EC2 C6in instances. To get started, see the AWS Management Console, AWS Command Line Interface (AWS CLI), and AWS SDKs.
Amazon EMR Serverless makes it simple to run open-source big data analytics frameworks without configuring, managing, and scaling clusters or servers. Today, we are excited to announce support for specifying permissions inline when submitting a job run. This allows you to define fine-grained, tenant-specific permission scopes per job run for multi-tenant use cases.
When submitting a job run on EMR Serverless, you can specify a runtime role that the job run can assume when calling other AWS services. In multi-tenant environments, such as those managed by SaaS providers, job runs are often submitted on behalf of specific tenants. To ensure security and least privileges, it is necessary to scope down the permissions of the runtime role to the specific context of a tenant for a given job run. Achieving this requires creating a separate role for each tenant with restricted permissions. The proliferation of such roles can push the account limits of IAM as well as get unwieldy to manage. Now you can specify an inline permission policy when submitting a job run in addition to the runtime role. The effective permissions for a job run is the intersection of the inline policy and the runtime role. You can define the fine-grained, tenant-specific permissions for a job run in the inline policy removing the need to manage a growing number of roles in multi-tenant environments as well as easily adjust the policy definition for tenant-specific workloads.
This feature is available for all supported EMR releases and in all regions where EMR Serverless is available. To learn more, visit Runtime Policy.
Editor’s note: Today’s post is by Choi HeeJung, Chief Information Officer forKorean Air, one of the world’s top 20 airlines, serving 117 cities across 40 countries on five continents. Renowned for its commitment to excellence and customer satisfaction, Korean Air—named AirlineRating’s 2025 airline of the year—chose ChromeOS to further elevate its exceptional 24/7 global customer service.
“Our move to ChromeOS was about more than just replacing old hardware. It was a strategic step in our journey to remove dependencies on legacy systems like Active Directory and build a more agile, secure, and efficient IT environment.“
Snapshot:
Improved efficiency: Agents have become significantly more productive, saving 5-7 minutes in boot up time with Chromeboxes.
Stronger security and easier IT: Built-in security and centralized management freed up IT time and reduced vulnerabilities.
Future ready and innovative: Agents have been able to utilize Gemini to search for information in Google Drive, get help drafting customer emails and even assist with translating inquiries from different languages.
Over the last ten years, Korean Air has been on a remarkable journey of digital transformation. Our CEO set a clear vision to modernize our infrastructure and empower our employees with the best tools available. This vision led us to deploy a full-scale adoption of Google Workspace, a decision that proved crucial during the COVID-19 pandemic.
Thanks to Google Workspace, our teams could work remotely and collaborate seamlessly, fostering a more open and democratic culture that continues today. But this was just the beginning. Our next big challenge was to modernize our end-user computing, starting with the heart of our customer interactions: the contact center.
Outdated systems in a 24/7 Environment
Our Seoul contact center, the largest of our five global centers, operates nearly 24 hours a day. Our legacy based solution presented significant hurdles. The devices were slow, sometimes taking five to seven minutes to boot up. In a fast-paced environment where every second counts, this was a major drag on productivity. We were also constantly dealing with forced updates and the dreaded “blue screen,” which interrupted operations and frustrated our agents.
From a security standpoint, we were exposed. Because our contact centers operate 24/7, we couldn’t perform necessary updates and security patches as frequently as we needed to. This left us vulnerable to malware and other security threats. Furthermore, the bulky hardware took up valuable desk space, making it difficult for agents who needed multiple monitors to handle increasingly complex customer inquiries. We knew we needed a solution that was secure, efficient, and designed for the modern, cloud-based world we were building.
A seamless transition to ChromeOS
Our move to the cloud and web-based applications made ChromeOS the logical next step. We decided to deploy 670 ASUS Chromeboxes for 700 users in our Seoul contact center. ASUS was able to manufacture a custom Korean keyboard specifically for us and Google, and Megazone, Google’s partner, was able to help us educate agents on ChromeOS native keyboard shortcuts prior to the launch. By providing training and working with our partners, we ensured a smooth transition for our agents.
Thanks to zero-touch enrollment, our ChromeOS devices were ready to use straight out of the box, making deployment effortless for both IT and our agents. The immediate speed was the first thing everyone noticed; the devices boot in seconds, providing an instant start to the workday that became a celebrated advantage. The compact Chromebox design was another huge win, freeing up valuable desk space and enabling the multi-monitor setups essential for effective multitasking. This newfound efficiency empowers our agents to handle more calls per minute, directly boosting customer satisfaction.
For our IT department, the benefits have been just as profound. Managing this fleet is now incredibly efficient. Using the Google Admin console, our small IT team can centrally manage policies and troubleshoot issues with ease. We no longer have to worry about running antivirus software or scheduling downtime for security updates, as security is built into the core of ChromeOS. This has not only improved our security posture but has also led to significant cost savings, and allowed us to redeploy valuable IT resources to strategic projects vs. low value maintenance, like updates.
AI-powered agents and a company-wide vision
With the foundation of ChromeOS firmly in place, we are now focused on the next wave of innovation: AI. We rolled out Google Workspace with Gemini to our second-level agents—the Korean Air staff who handle the most complex customer issues. Our goal is to empower them to serve customers with even greater confidence. With Gemini, they can instantly search for information across Google Drive, get help drafting replies to customer emails, and even assist with translating inquiries from different languages.
Leveraging Amazon Connect, a Chrome Enterprise Recommended partner, we have also redefined our internal quality assurance process. The screen recording application allows us to analyze an agent’s on-screen workflow during customer interactions. This provides insights needed for targeted coaching and process refinement, ensuring we consistently improve our customers’ experience with agents.
The success of our contact center deployment has been so convincing that our leadership has approved a plan to transition the entire company to ChromeOS next year. We are actively working with Google, looking into solutions like Cameyo to ensure that even employees who rely on legacy applications like MS Office or our ERP system have a seamless experience. Our philosophy is not just customer-centric but employee-centric; the user experience is paramount.
Looking back, our move to ChromeOS was about more than just replacing old hardware. It was a strategic step in our journey to remove dependencies on legacy systems like Active Directory and build a more agile, secure, and efficient IT environment. By embracing the cloud and tools from Google, we’re not just keeping pace with change—we’re creating a more innovative and collaborative future for Korean Air.
Thanks to zero-touch enrollment, our ChromeOS devices were ready to use straight out of the box, making deployment effortless for both IT and our agents.
Choi HeeJung
Chief Information Officer, Korean Air
A seamless transition to ChromeOS
Our move to the cloud and web-based applications made ChromeOS the logical next step. We decided to deploy 670 ASUS Chromeboxes for 700 users in our Seoul contact center. ASUS was able to manufacture a custom Korean keyboard specifically for us and Google, and Megazone, Google’s partner, was able to help us educate agents on ChromeOS native keyboard shortcuts prior to the launch. By providing training and working with our partners, we ensured a smooth transition for our agents.
Thanks to zero-touch enrollment, our ChromeOS devices were ready to use straight out of the box, making deployment effortless for both IT and our agents. The immediate speed was the first thing everyone noticed; the devices boot in seconds, providing an instant start to the workday that became a celebrated advantage. The compact Chromebox design was another huge win, freeing up valuable desk space and enabling the multi-monitor setups essential for effective multitasking. This newfound efficiency empowers our agents to handle more calls per minute, directly boosting customer satisfaction.
For our IT department, the benefits have been just as profound. Managing this fleet is now incredibly efficient. Using the Google Admin console, our small IT team can centrally manage policies and troubleshoot issues with ease. We no longer have to worry about running antivirus software or scheduling downtime for security updates, as security is built into the core of ChromeOS. This has not only improved our security posture but has also led to significant cost savings, and allowed us to redeploy valuable IT resources to strategic projects vs. low value maintenance, like updates.
AI-powered agents and a company-wide vision
With the foundation of ChromeOS firmly in place, we are now focused on the next wave of innovation: AI. We rolled out Google Workspace with Gemini to our second-level agents—the Korean Air staff who handle the most complex customer issues. Our goal is to empower them to serve customers with even greater confidence. With Gemini, they can instantly search for information across Google Drive, get help drafting replies to customer emails, and even assist with translating inquiries from different languages.
Leveraging Amazon Connect, a Chrome Enterprise Recommended partner, we have also redefined our internal quality assurance process. The screen recording application allows us to analyze an agent’s on-screen workflow during customer interactions. This provides insights needed for targeted coaching and process refinement, ensuring we consistently improve our customers’ experience with agents.
The success of our contact center deployment has been so convincing that our leadership has approved a plan to transition the entire company to ChromeOS next year. We are actively working with Google, looking into solutions like Cameyo to ensure that even employees who rely on legacy applications like MS Office or our ERP system have a seamless experience. Our philosophy is not just customer-centric but employee-centric; the user experience is paramount.
Looking back, our move to ChromeOS was about more than just replacing old hardware. It was a strategic step in our journey to remove dependencies on legacy systems like Active Directory and build a more agile, secure, and efficient IT environment. By embracing the cloud and tools from Google, we’re not just keeping pace with change—we’re creating a more innovative and collaborative future for Korean Air.
Amazon Simple Queue Service (Amazon SQS) now offers fair queues, a new feature that mitigates noisy neighbor impact in multi-tenant standard queues. When one tenant (such as a customer, client application, or request type) sends too many messages or has messages that require longer processing time, fair queues help keep other tenants’ messages flowing without long delays. This preserves quality of service for all tenants while maintaining the scalability and throughput of standard queues.
To enable fair queues, include a message group ID when sending messages to your Amazon SQS standard queues. No changes to message consumers are required, allowing you to adopt fair queues in live systems with no interruption or migration. Fair queues are particularly valuable for SaaS applications serving multiple customers through shared queues, microservices processing events from multiple resources, and applications handling messages for different request types. Fair queues help maintain consistent dwell time (the time a message spends in the queue between being sent and received) across tenants by reordering messages when a single tenant causes the queue to build a backlog. The queue then prioritizes delivering messages from other tenants. Messages from the tenant causing the backlog continue to be delivered to consumers, but their dwell time increases based on your available consumer capacity.
Fair queues are available in all AWS commercial and AWS GovCloud (US) Regions. For more information about Amazon SQS fair queues, read our blog post and visit Amazon SQS Developer Guide.