Azure – Windows 11 public preview is now available on Azure Virtual Desktop
You can now run Windows 11 preview images on Azure Virtual Desktop.
Read More for the details.

You can now run Windows 11 preview images on Azure Virtual Desktop.
Read More for the details.
AWS IoT Greengrass is an Internet of Things (IoT) edge runtime and cloud service that helps customers build, deploy, and manage device software. Our version 2.4 release includes two new sets of features that simplify the provisioning of large fleets of IoT devices and allow fine-grained control of IoT device system resources from the cloud:
Read More for the details.
You can now send data from SAP ERP applications (ECC, BW, BW4/HANA and S/4HANA) to AWS services in just a few clicks using Amazon AppFlow and SAP Operational data provisioning (ODP) framework.
Read More for the details.
IT teams are responsible for creating the digital working conditions for their employees to do their best work. Because Chrome is built with users in mind, it comes with lots of capabilities you can give to your workforce to improve their productivity, efficiency, and security. We’ve put together a list of some of our favorite new Chrome capabilities for the work day, and created email templates you can use to share tips with your organization today – don’t miss those at the bottom of this post!
Here are some new tips you can share with your employees to help them get the most out of Chrome:
Chrome Actions let you get tasks done right from the address bar, saving you time! Last year, we released actions like “Clear browsing data” and “Manage passwords” to make it even easier to manage your privacy and security settings. Recently, we launched 16 more actions to help people get things done fast and stay safe online – including shortcuts to run Chrome’s safety check and integrations with Google Workspace. To use them, type a couple “trigger words” into the address bar and click the button that appears. To see the new actions, try typing: “safety check”, “new Google doc”, “manage my Google account” and more.
Our new actions are currently available in English and we’ll bring them to other languages soon.
With Chrome Profiles, people are able to keep work and personal accounts separate to make sure important information like bookmarks, history, passwords and other settings are saved to the right account. This is increasingly important as the workplace continues to shift into a hybrid environment. Users can access both accounts from the same browser with a simple switch. Just click on your profile icon or picture on the top right of your browser and select from the list of accounts under “other profiles”.
On any given day at work, it’s common for users to have many tabs open. Although this is often necessary to accomplish complex information work, sometimes it can be hard to find the tab you’re looking for. Chrome’s tab groups and tab search capabilities can help users solve this problem by organizing your tabs into groups or searching all tabs at once. To create a group, just right-click a tab and click “Add Tab to new group.” To find an open tab, simply click on the downward arrow icon on the top right of your browser and start searching.
Sometimes the best capabilities are ones that work in the background automatically to keep you safe while you focus on other tasks at work. As of Chrome’s newest release, its industry-leading Site Isolation technology, which protects you from malicious websites, is starting to cover a broader range of websites and extensions.
Additionally, Chrome’sphishing detection feature now processes content 50 times faster while saving more battery than ever before. It’s even easier to speed around the web while staying protected.
To help you share more resources with your end users, we’ve created the Chrome help kit which includes three user-friendly documents with quick tips for productivity, security, and privacy. We’ve also created a customizable email template you can use to introduce the kit to your employees and promote adoption of these features. All you need to do is download and send.
If you’d like to learn more about other features your end users can benefit from, check out the newest blog post about privacy and performance. Chrome has more end user features coming your way in the near future, so stay tuned for the latest and greatest from Chrome.
Read More for the details.
Processing streaming data to extract insights and powering real time applications is becoming more and more critical. Google Cloud Dataflow and Pub/Sub provides a highly scalable, reliable and mature streaming analytics platform to run mission critical pipelines. One very common challenge that developers often face when designing such pipelines is how to handle duplicate data.
In this blog, I want to give an overview of common places where duplicate data may originate in your streaming pipelines and discuss various options that are available to you to handle them. You can also check out this tech talk on the same topic.
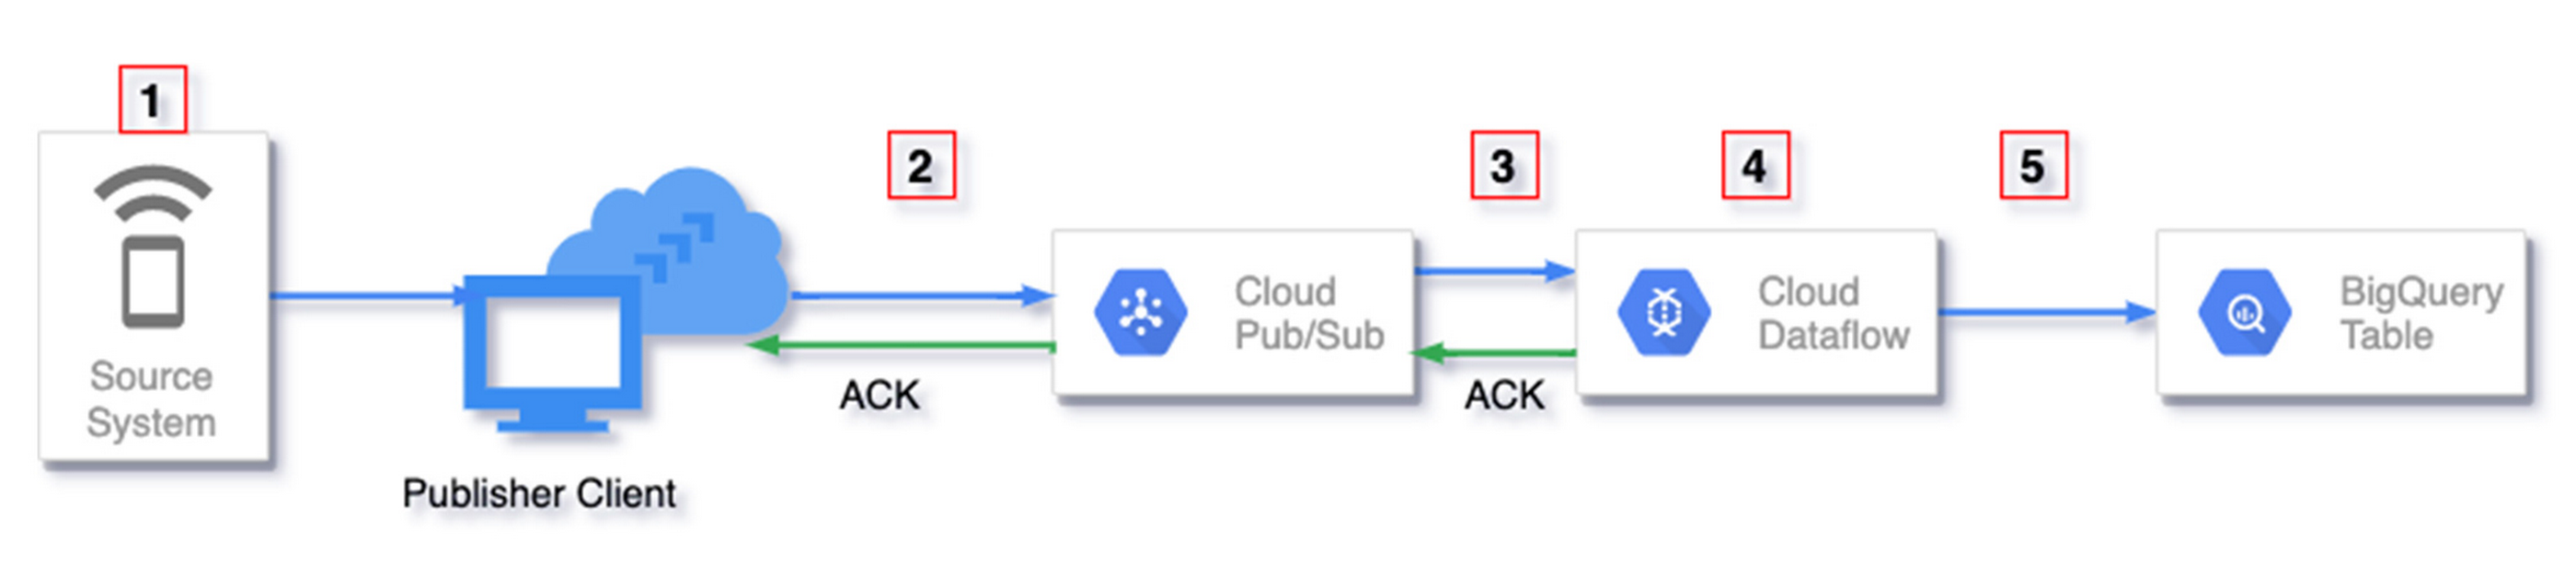
This section gives an overview of the places where duplicate data may originate in your streaming pipelines. Numbers in red boxes in the following diagram indicate where this may happen.
Some duplicates are automatically handled by Dataflow while for others developers may need to use some techniques to handle them. This is summarized in the following table.
One example where this could happen is when you set trigger notifications from Google Cloud Storage to Pub/Sub in response to object changes to GCS buckets. This feature guarantees at-least-once delivery to Pub/Sub and can produce duplicate notifications.
2. Publisher generated duplicates
Your publisher when publishing messages to Pub/Sub can generate duplicates due to at-least-once publishing guarantees. Such duplicates are referred to as ‘publisher generated duplicates’.
Pub/Sub automatically assigns a unique message_id to each message successfully published to a topic. Each message is considered successfully published by the publisher when Pub/Sub returns an acknowledgement to the publisher. Within a topic all messages have a unique message_id and no two messages have the same message_id. If success of the publish is not observed for some reason (network delays, interruptions etc) the same message payload may be retried by the publisher. If retries happen, we may end up with duplicate messages with different message_id in Pub/Sub. For Pub/Sub these are unique messages as they have different message_id.
3. Reading from Pub/Sub
Pub/Sub guarantees at least once delivery for every subscription. This means that a message may be delivered more than once by the same subscription if Pub/Sub doesn’t receive acknowledgement within the acknowledgement deadline. The subscriber may acknowledge after the acknowledgement deadline or the acknowledgement may be lost due to transient network issues. In such scenarios the same message would be redelivered and subscribers may see duplicate data. It is the responsibility of the subscribing system (for example Dataflow) to detect such duplicates and handle accordingly.
When Dataflow receives messages from Pub/Sub subscription, messages are acknowledged after they are successfully processed by the first fused stage. Dataflow does optimization called fusion where multiple stages can be combined into a single fused stage. A break in fusion happens when there is a shuffle which happens if you have transforms like GROUP BY, COMBINE or I/O transforms like BigQueryIO. If a message has not been acknowledged within its acknowledgement deadline, Dataflow attempts to maintain the lease on the message by repeatedly extending the acknowledgement deadline to prevent redelivery from Pub/Sub. However this is best effort and there is a possibility that messages may be redelivered. This can be monitored using metrics listed here.
However, because Pub/Sub provides each message with a unique message_id, Dataflow uses it to deduplicate messages by default if you use the built-in Apache Beam PubSubIO. Thus Dataflow filters out such duplicates originating from redelivery of the same message by Pub/Sub. You can read more about this topic on one of our earlier blog under the section “Example source: Cloud Pub/Sub”
4. Processing data in Dataflow
Due to the distributed nature of processing in Dataflow each message may be retried multiple times on different Dataflow workers. However Dataflow ensures that only one of those tries wins and the processing from the other tries does not affect downstream fused stages. Dataflow does guarantee exactly once processing by leveraging checkpointing at each stage to ensure such duplicates are not reprocessed affecting state or output. You can read more about how this is achieved in this blog.
5. Writing to a sink
Each element can be retried multiple times by Dataflow workers and may produce duplicate writes. It is the responsibility of the sink to detect these duplicates and handle them accordingly. Depending on the sink, duplicates may be filtered out, over-written or appear as duplicates.
File systems as sink
If you are writing files, exactly once is guaranteed as any retries by Dataflow workers in event of failure will overwrite the file. Beam provides several I/O connectors to write files, all of which guarantees exactly once processing.
If you use the built-in Apache Beam BigQueryIO to write messages to BigQuery using streaming inserts, Dataflow provides a consistent insert_id (different from Pub/Sub message_id) for retries and this is used by BigQuery for deduplication. However, this deduplication is best effort and duplicate writes may appear. BigQuery provides other insert methods as well with different deduplication guarantees as listed below.
You can read more about BigQuery insert methods at the BigQueryIO Javadoc. Additionally for more information on BigQuery as a sink check out the section “Example sink: Google BigQuery” in one of our earlier blog.
For duplicates originating from places discussed in points 3), 4) and 5) there are built-in mechanisms in place to remove such duplicates as discussed above, assuming BigQuery is a sink. In the following section we will discuss deduplication options for ‘source generated duplicates’ and ‘publisher generated duplicates’. In both cases, we have duplicate messages with different message_id, which for Pub/Sub and downstream systems like Dataflow are two unique messages.
1. Use Pub/Sub message attributes
Each message published to a Pub/Sub topic can have some string key value pairs attached as metadata under the “attributes” field of PubsubMessage. These attributes are set when publishing to Pub/Sub. For example, if you are using the Python Pub/Sub Client Library, you can set the “attrs” parameter of the publish method when publishing messages. You can set the unique fields (e.g: event_id) from your message as attribute value and field name as attribute key.
Dataflow can be configured to use these fields to deduplicate messages instead of the default deduplication using Pub/Sub message_id. You can do this by specifying the attribute key when reading from Pub/Sub using the built-in PubSubIO.
For Java SDK, you can specify this attribute key in the withIdAttribute method of PubsubIO.Read() as shown below.
In the Python SDK, you can specify this in the id_label parameter of the ReadFromPubSub PTransform as shown below.
This deduplication using a Pub/Sub message attribute is only guaranteed to work for duplicate messages that are published to Pub/Sub within 10 minutes of each other.
2. Use Apache Beam Deduplicate PTransform
Apache Beam provides deduplicate PTransforms which can deduplicate incoming messages over a time duration. Deduplication can be based on the message or a key of a key value pair, where the key could be derived from the message fields. The deduplication window can be configured using the withDuration method, which can be based on processing time or event time (specified using the withTimeDomain method). This has a default value of 10 mins.
You can read the Java documentation or the Python documentation of this PTransform for more details on how this works.
This PTransform uses the Stateful API under the hood and maintains a state for each key observed. Any duplicate message with the same key that appears within the deduplication window is discarded by this PTransform.
3. Do post-processing in sink
Deduplication can also be done in the sink. This could be done by running a scheduled job that periodically deduplicates rows using a unique identifier.
BigQuery as a sink
If BigQuery is the sink in your pipeline, scheduled query can be executed periodically that writes the deduplicated data to another table or updates the existing table. Depending on the complexity of the scheduling you may need orchestration tools like Cloud Composer or Dataform to schedule queries.
Deduplication can be done using a DISTINCT statement or DML like MERGE. You can find sample queries about these methods on these blogs (blog 1, blog 2).
Often in streaming pipelines you may need deduplicated data available in real time in BigQuery. You can achieve this by creating materialized views on top of underlying tables using a DISTINCT statement.
Any new updates to the underlying tables will be updated in real time to the materialized view with zero maintenance or orchestration.
Read More for the details.
tl;dr: We introduce the One-Click Triton Inference Server in Google Kubernetes Engine (GKE) Marketplace solution (solution, readme) to help jumpstart NVIDIA GPU-enabled ML inference projects.
Deep Learning research in the past decade has provided a number of exciting and useful models for a variety of different use cases. Less than 10 years ago, AlexNet was the state-of-the-art image classification model and brought the Imagenet moment marked as ground zero for deep learning explosion. Today, Bidirectional Encoder Representations from Transformers (BERT) and related family of models enable a variety of complex natural language use cases from Text Classification to Question and Answering (Q&A). While top researchers are creating bleeding edge models exceeding hundreds of millions of parameters, bringing these models to production in large-scale exposes additional challenges we have to solve.
While recent ML frameworks have made model training and experimentation more accessible, serving ML models, especially in a production environment, is still difficult. When building an inference environment, we commonly run into the following pain points:
Complex dependencies and APIs of DL Frameworks backend
Production workflow includes not just model inference but also preprocessing steps
Hard to find nobs to maximize accelerator performance
Too much scripting and configurations about robust Ingress and load balancing
In this blog, we will introduce the One-Click Triton Inference Server in Google Kubernetes Engine (GKE), and how the solution scales these ML models, meet stringent latency budgets, and optimize operational costs.
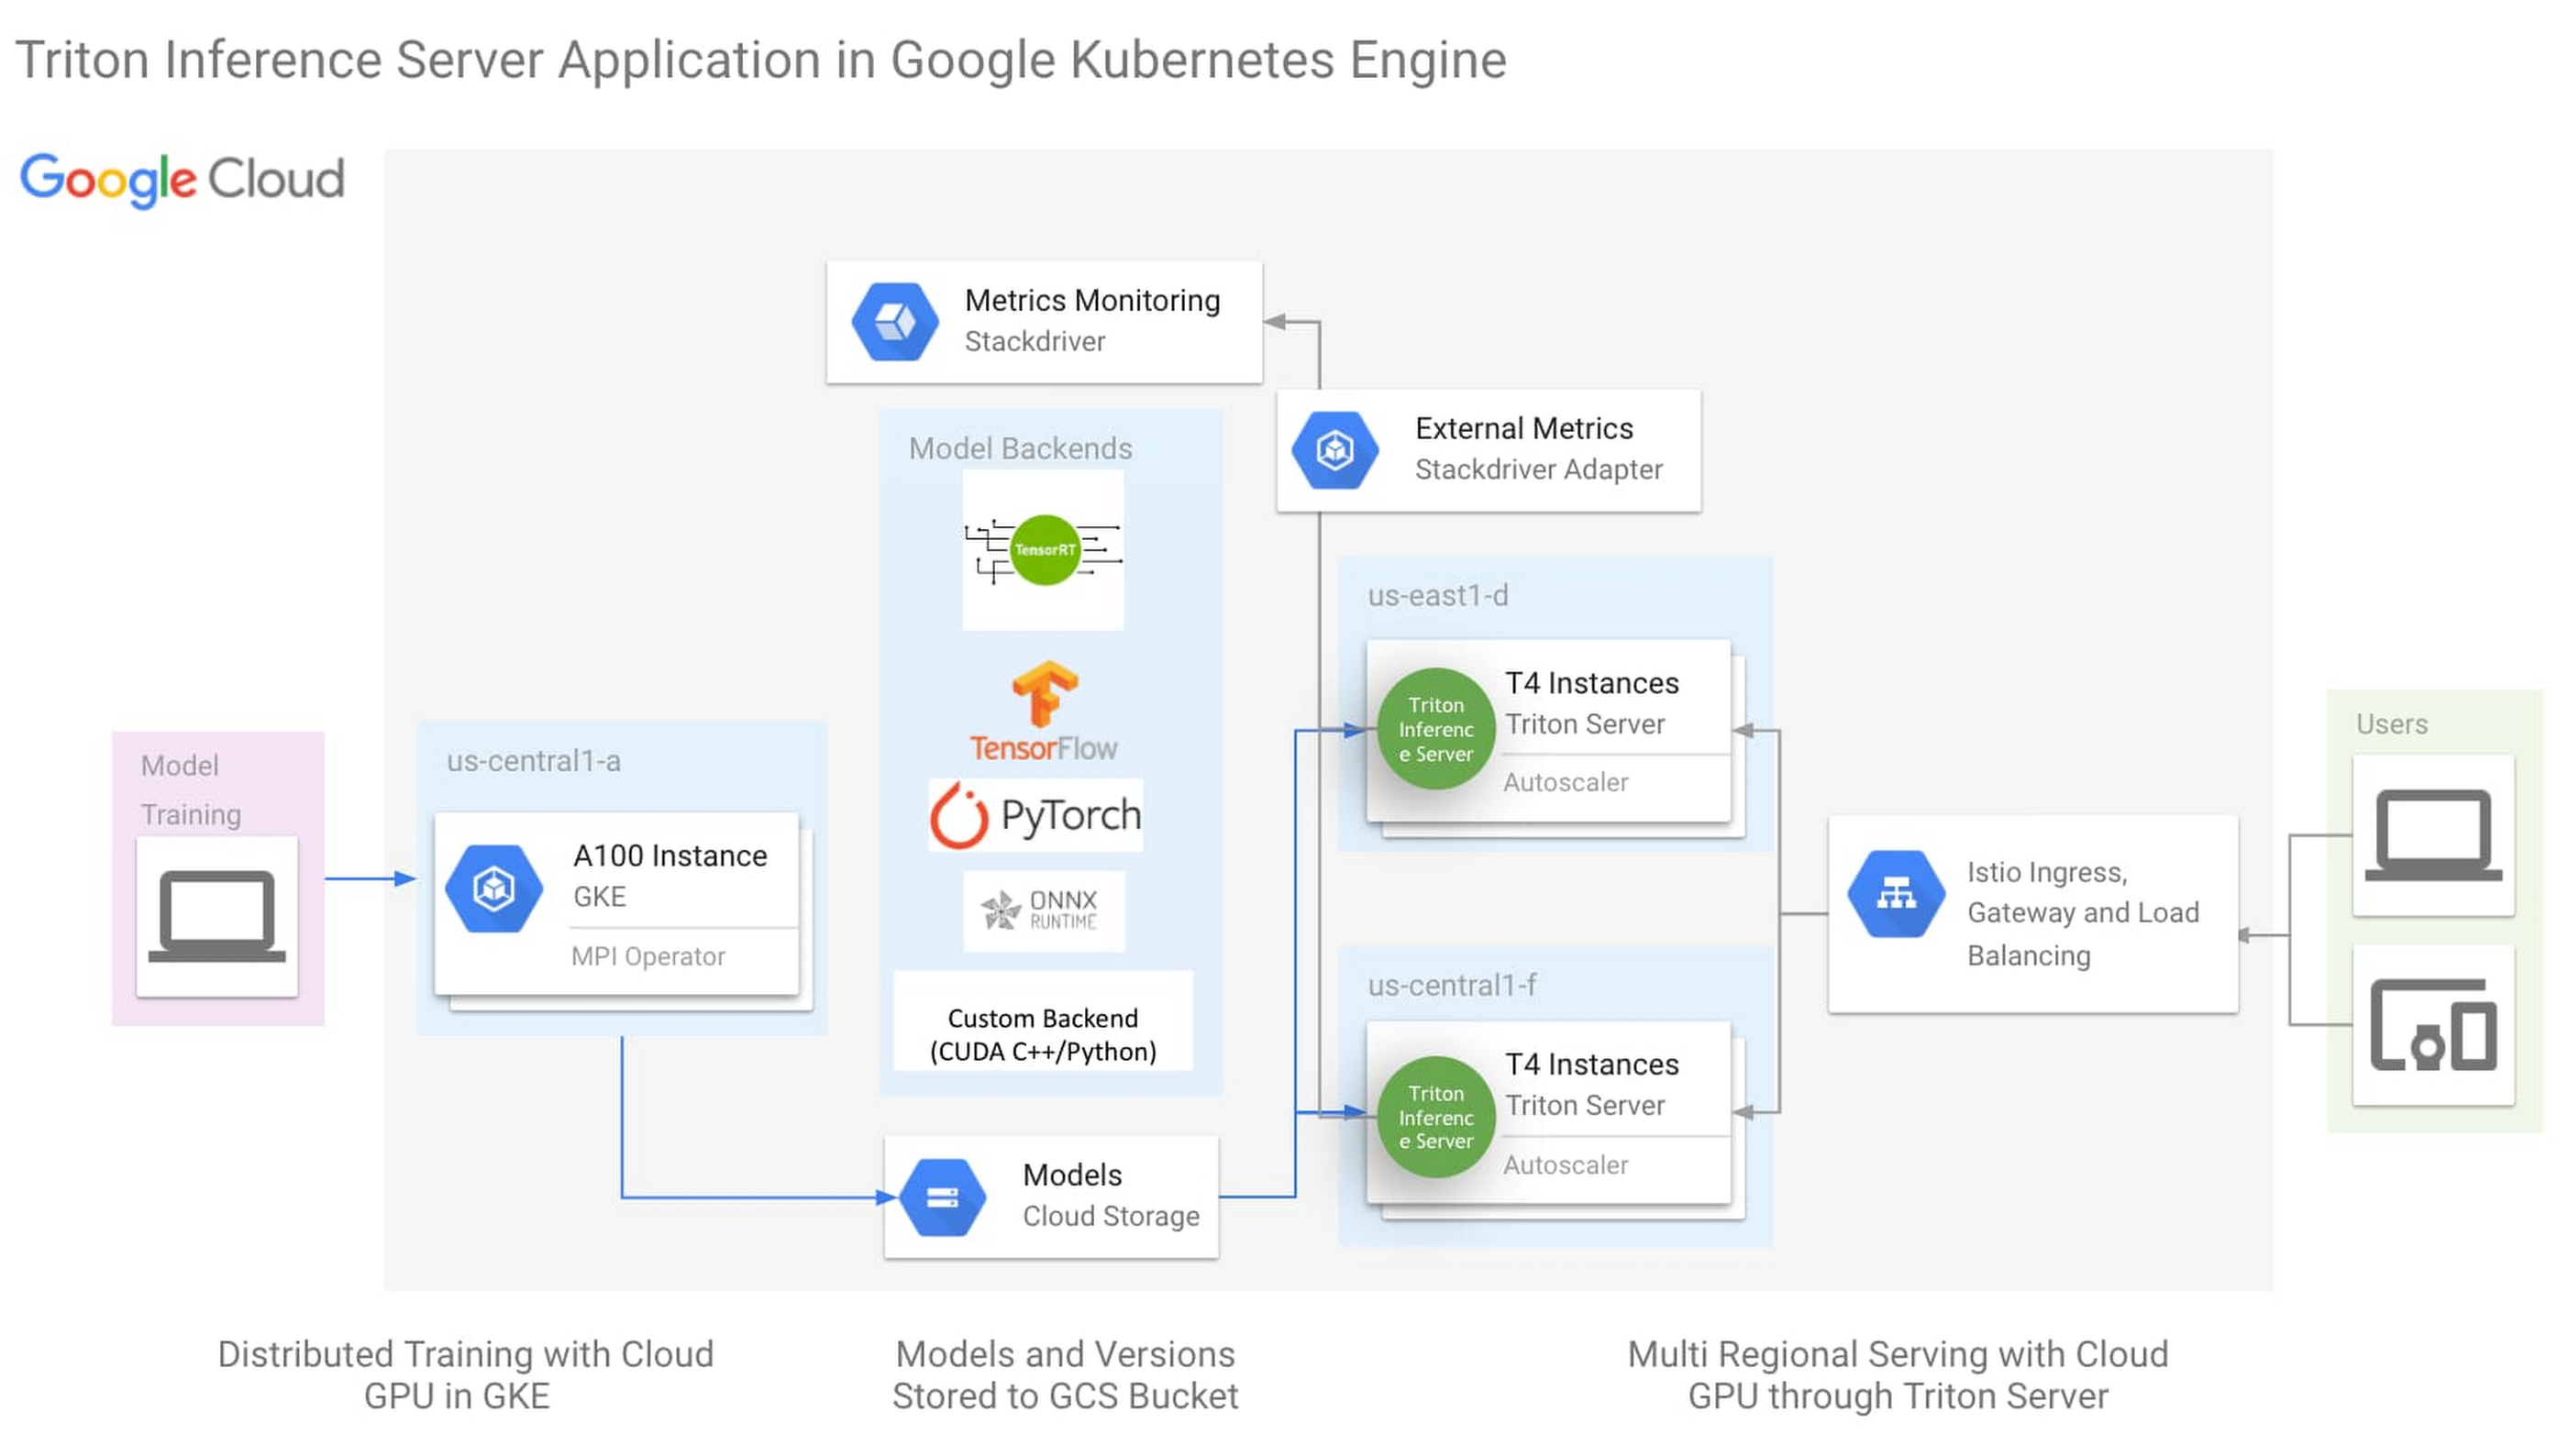
The architecture above is the One-Click NVIDIA Triton Inference Server solution (click here to try now), with the following key aspects:
NVIDIA Triton Inference Server
Istio for simplified Ingress and Load Balancing
Horizontal Pod Autoscaler(HPA) monitoring external metric through Stackdriver
Triton Inference Server is an open source inference server from NVIDIA with backend support for most ML Frameworks, as well as custom backend for python and C++. This flexibility simplifies ML infrastructure by reducing the need to run different inference servers to serve different frameworks. While Triton was created to leverage all the advanced features of the GPU, it is also designed to be highly performant on the CPU. With this flexibility in ML framework and processing hardware support, Triton can reduce the complexity of model serving infrastructure.
More detailed description of the One-Click Triton solution could be found here.
Organizations today are looking to create a shared-service ML platform to help democratize ML across their business units. To be successful, a share-service ML serving platform must be reliable and cost effective. To address these requirements NVIDIA has created two capabilities that are unique to the Triton Inference Server:
Model Priority
TensorRT
When we build a shared-service inference platform, we will need to expect to support models for multiple use cases, each with different latency sensitivity, business criticality, and transient load fluctuations. At the same time, we also need to consider control costs through standardization and economy of scale. However, these requirements are often in conflict. For example, a business-critical, latency-sensitive model with a strict Service Level Objective (SLO) will present to us two choices: do we pre-provision compute resources in anticipation of transient load fluctuations and pay for the excess unused compute, or do we provision only the typical compute resources needed to save cost, and risk violating the latency SLO when transient loads spike?
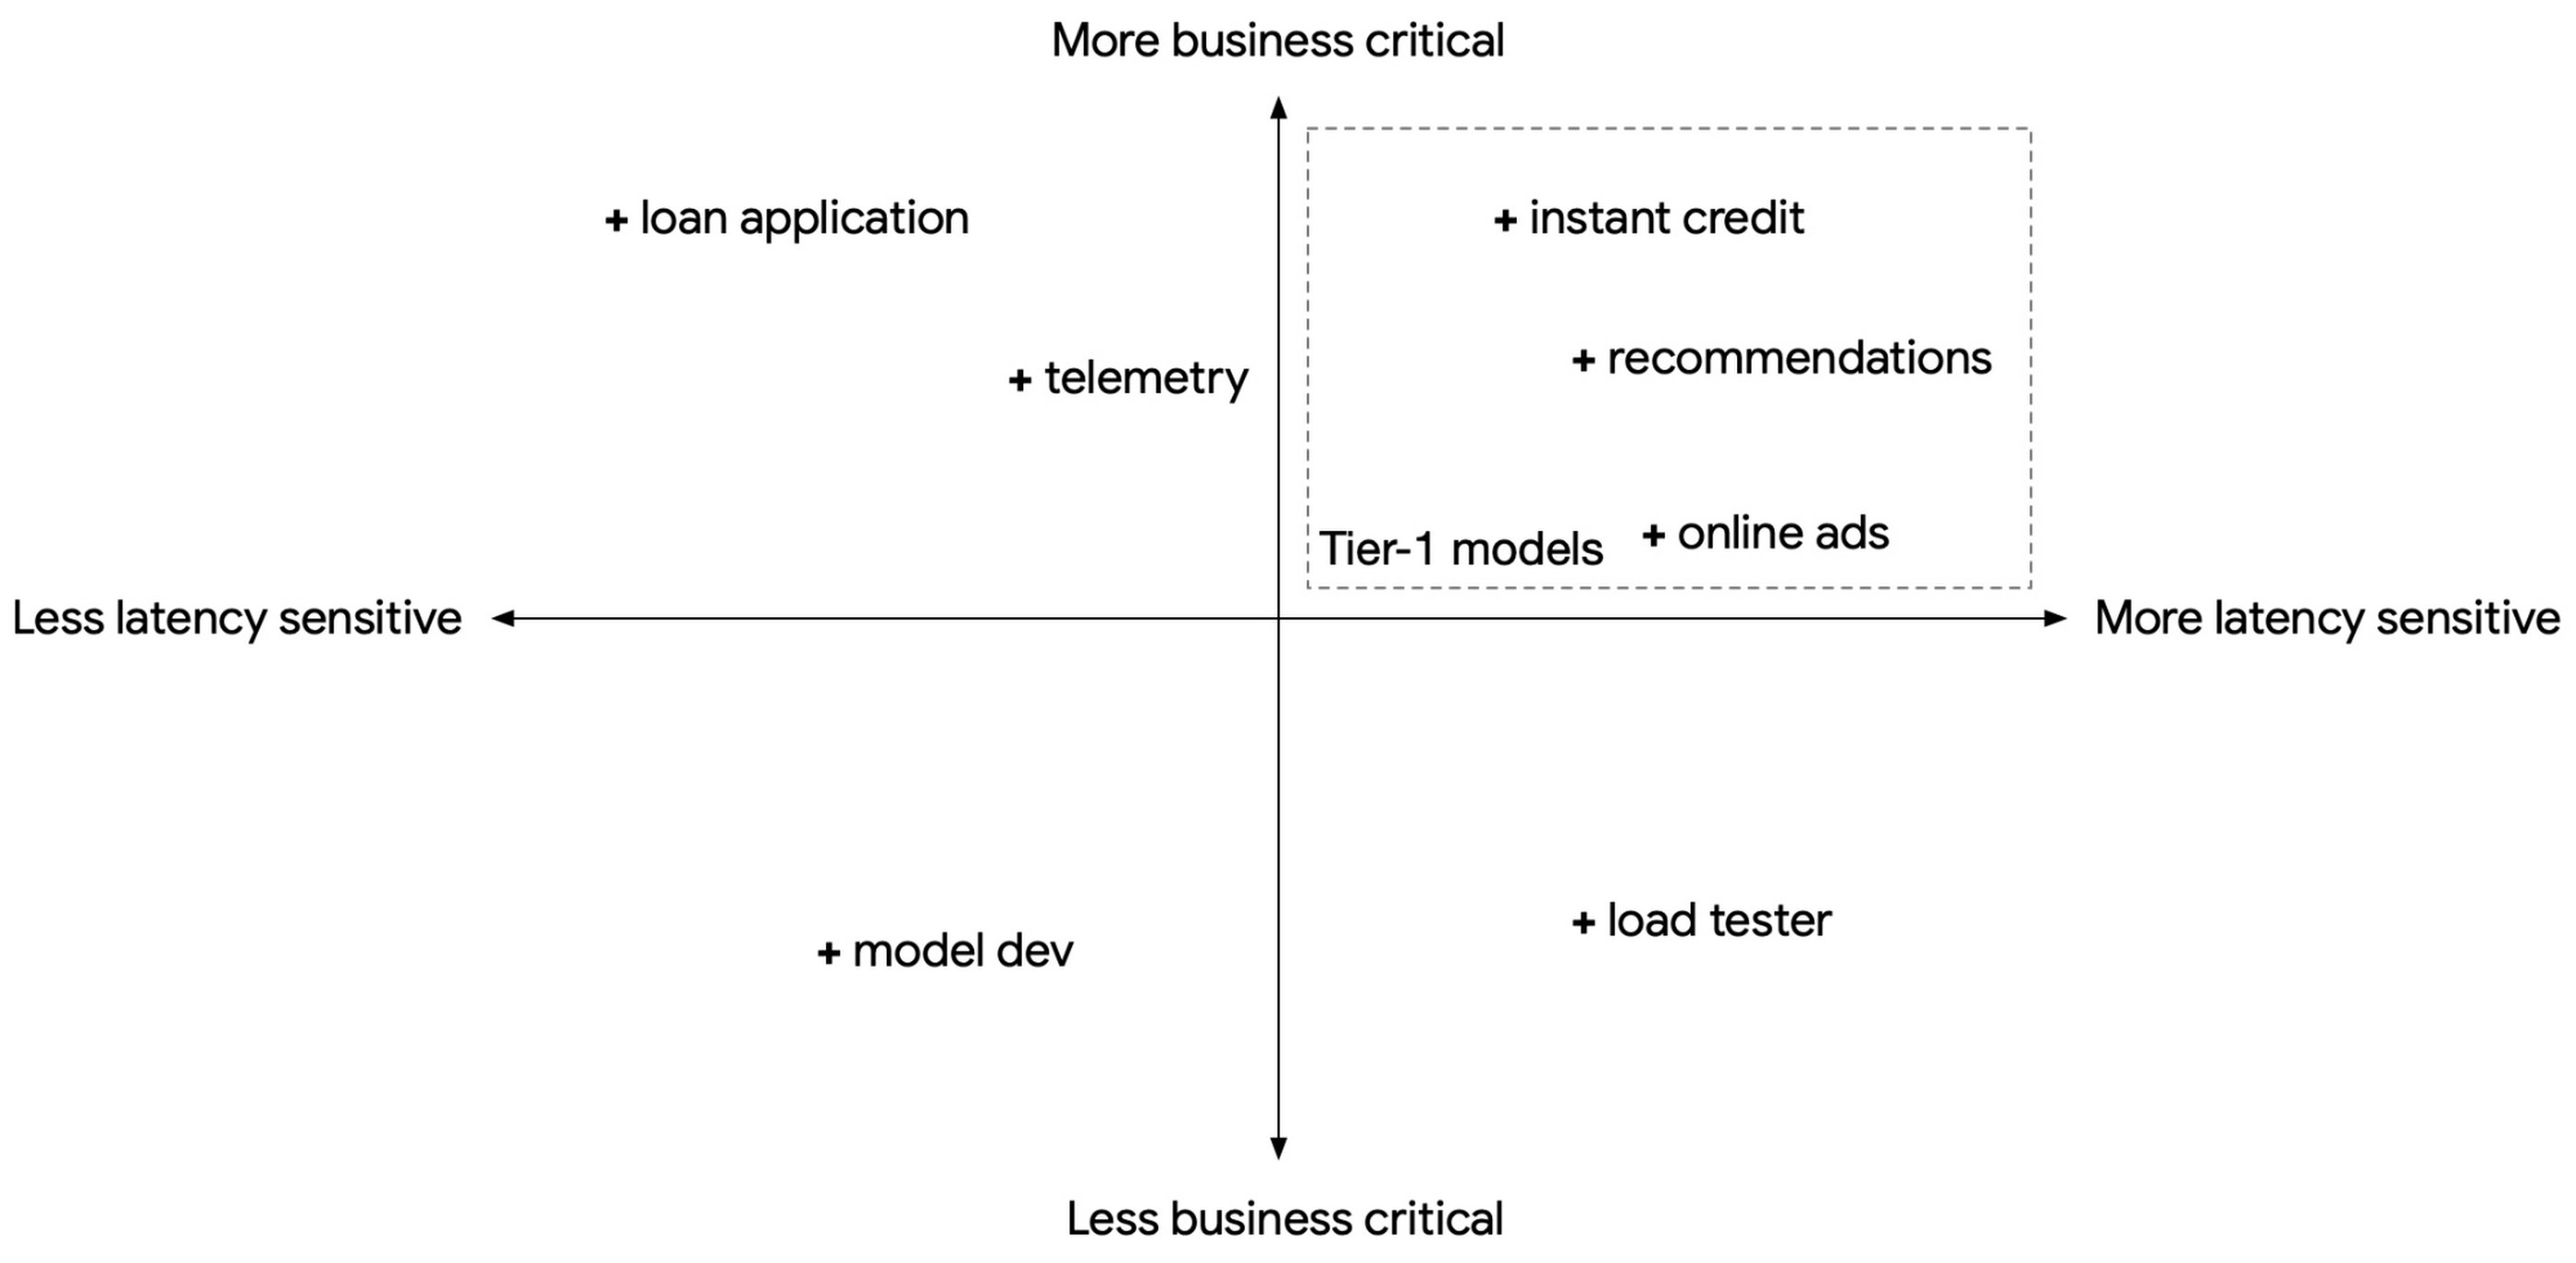
In the population of models we serve, we can usually find a subset that are both latency-sensitive and business critical. These can be treated as Tier-1 models, with the remaining as Tier-2.
With Triton Inference Server, we have the ability to mark a model as PRIORITY_MAX. This means when we consolidate multiple models in the same Triton instance and there is a transient load spike, Triton will prioritize fulfilling requests from PRIORITY_MAX models (Tier-1) at the cost of other models (Tier-2).
Below is an illustration of three common load spiking scenarios. In the first (1) scenario, load spikes but load is within the provisioned compute limit. Both models continue normally. In the second (2) scenario, the Tier-1 model spikes and the combined compute load exceeds the provisioned compute limit. Triton prioritizes the Tier-1 model by reducing compute on the Tier-2 model. In the third (3) scenario, the Tier-2 model spikes. Triton ensures the Tier-1 model will receive the compute resources it needs. In all three scenarios.
While GKE provides autoscaling, relying only on GKE to autoscale on transient load spikes can lead to SLO violation, as load spikes can appear in seconds, whereas GKE autoscales in minutes. Model priority provides a short window to buffer transient spikes to help maintain Tier-1 model SLO while GKE autoscales its nodepool. For a description of options to address transient load spikes, please refer to the reference guide Mitigating transient load effects on ML serving latency.
While Triton offers a multitude of backend framework support and a highly pluggable architecture, the TensorRT backend offers the best performance benefits.
NVIDIA TensorRT (TRT) is an SDK for high performance deep learning inference on NVIDIA GPU’s, leveraging out-of-box performance enhancements by applying optimization such as layer fusion, mixed precision and structured sparsity. With the latest NVIDIA A100 GPU as an example, TensorRT incorporates Tensor Cores, a region of the GPU optimized for FP16 and INT8 matrix math, with support for structured sparsity. For optimizations TensorRT applied to the BERT model, please visit the referenceblog.
The following Triton configuration will help GPU inference performance and utilization when used with TensorRT:
Concurrent execution: a separate copy of the model is run in its own separate CUDA stream, allowing for concurrent CUDA kernel executions simultaneously. This allows for increased parallelization.
Dynamic batching: Triton will dynamically group together multiple inference requests on the server-side within the constraint of specified latency requirements.
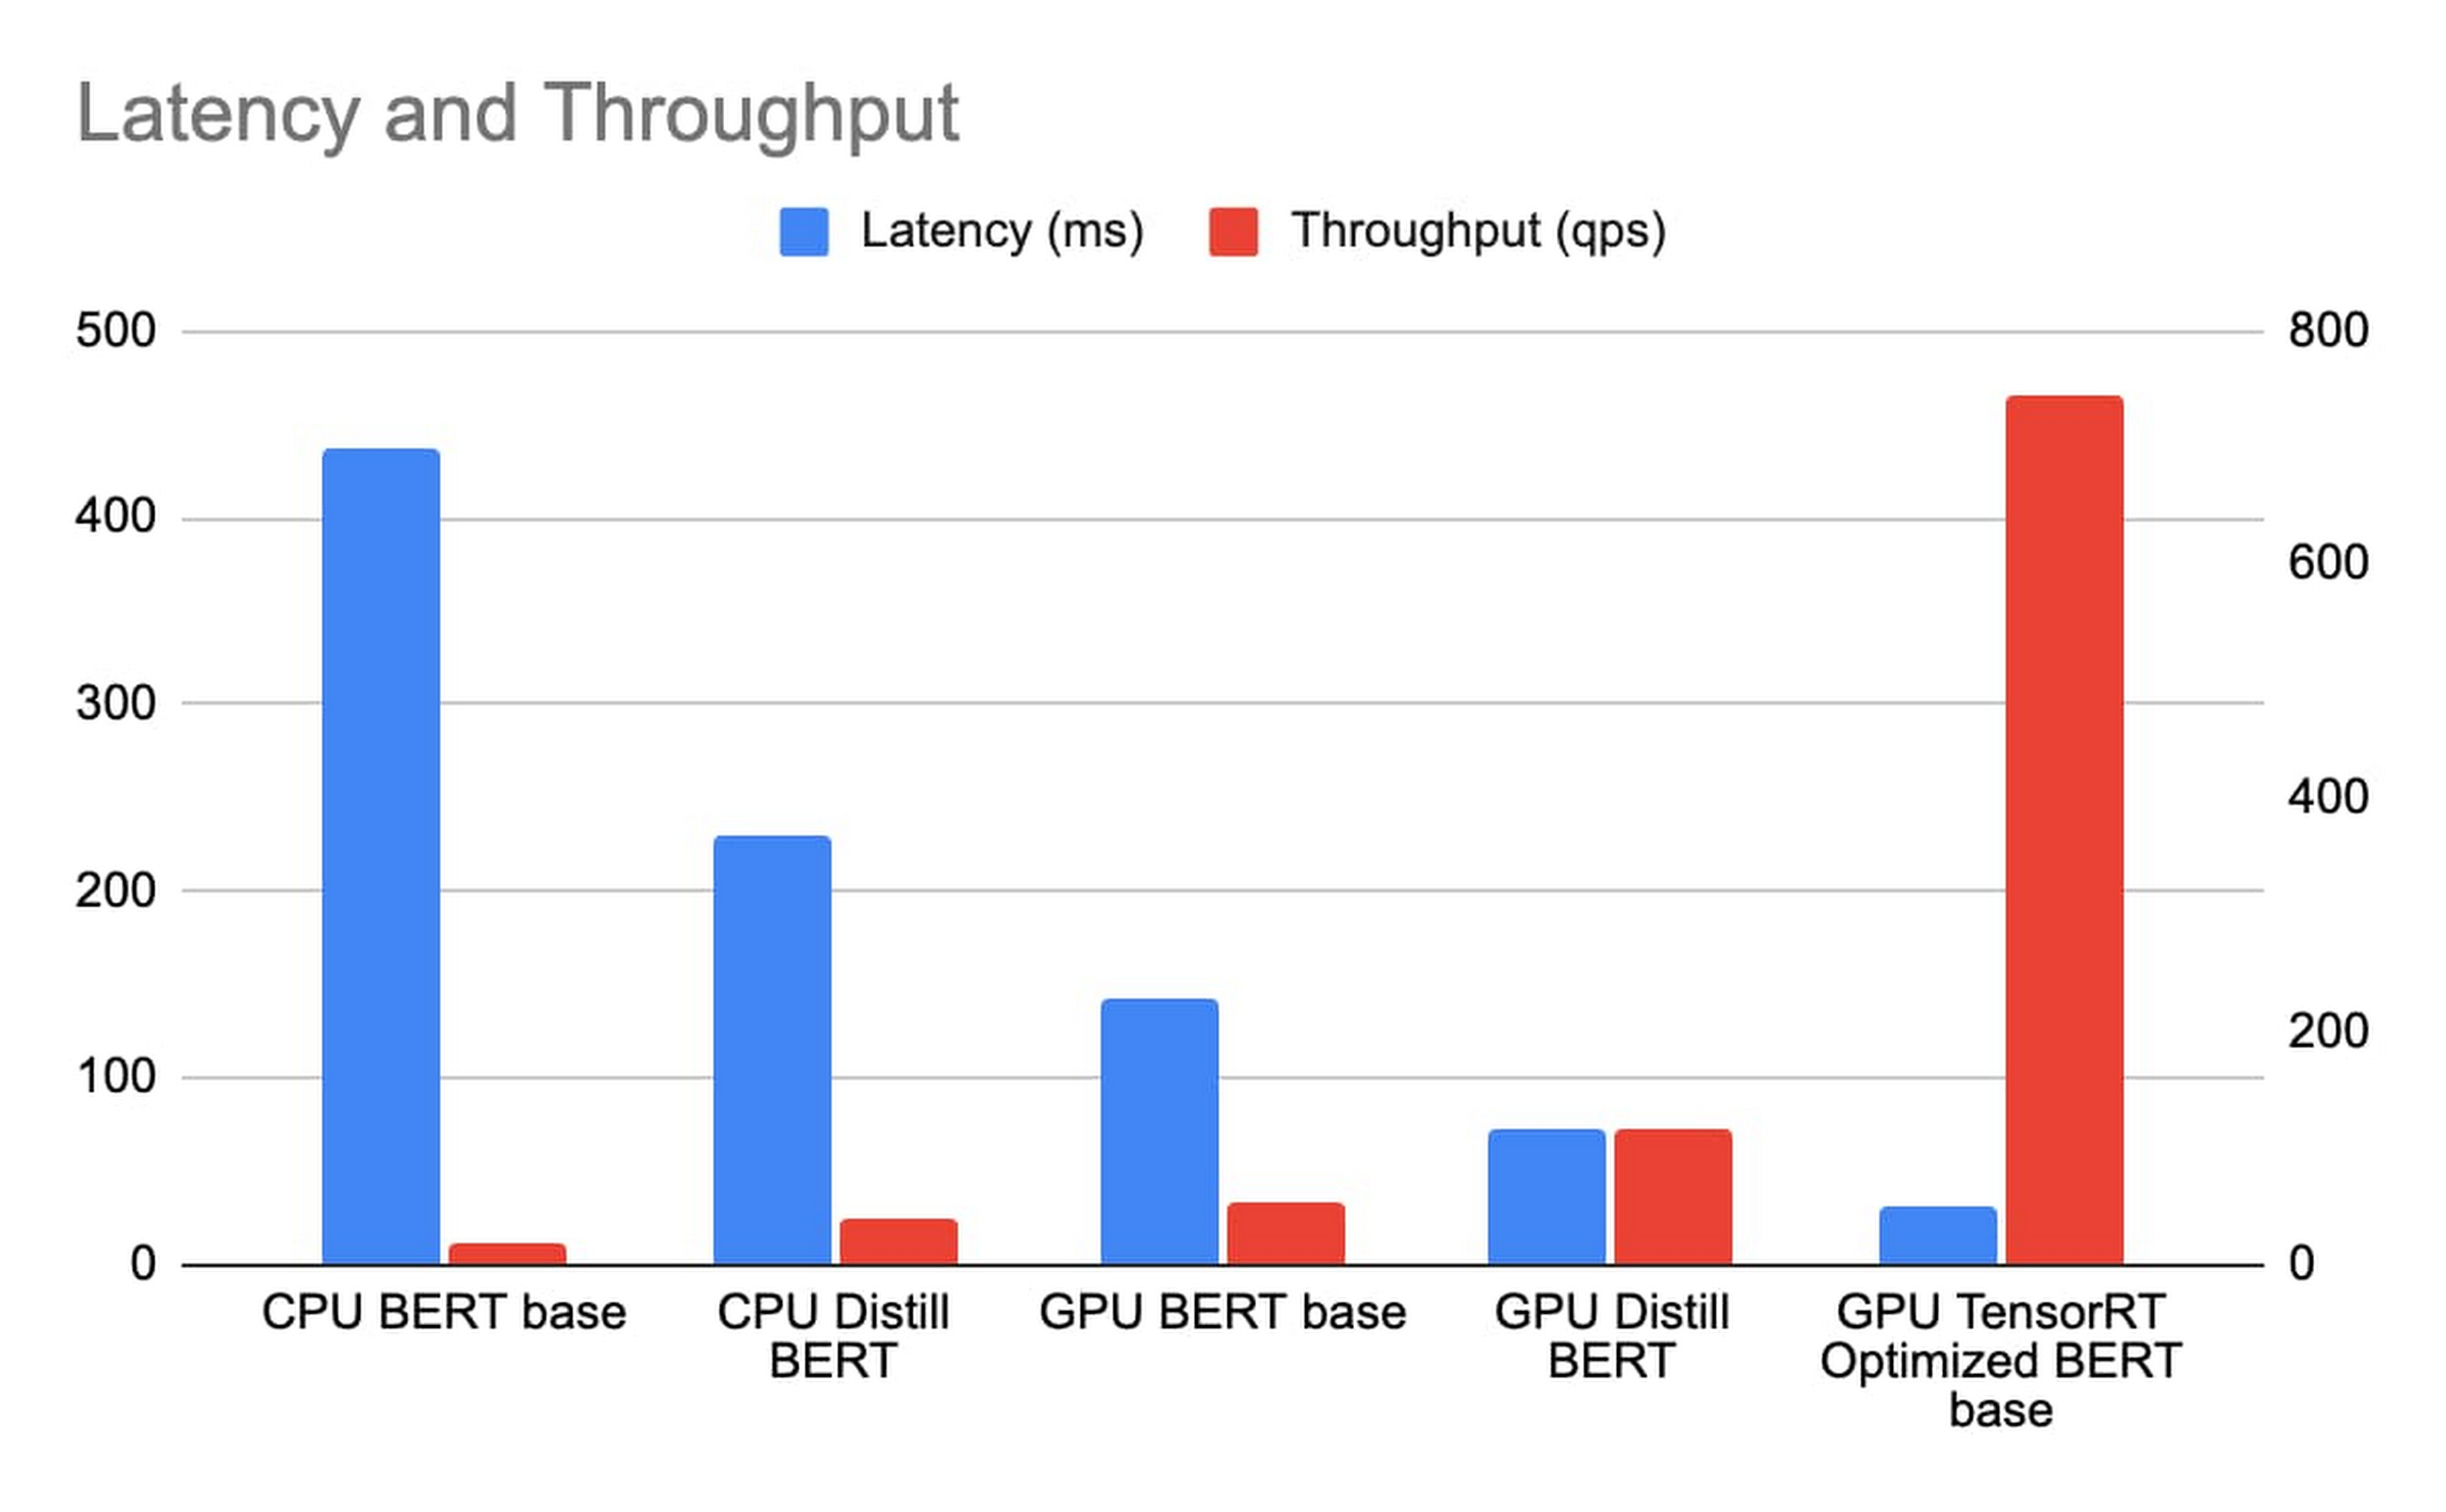
We deploy CPU BERT BASE and Distill BERT on n1-standard-96, and GPU BERT BASE, Distill BERT and BERT BASE with TRT optimization on n1-standard-4 with 1 T4 GPU, with sequence length of the BERT model being 384 token. We measure the latency and throughput with a concurrency sweep with Triton’s performance analyzer. The latency includes Istio ingress/load balancing and reflects the true end to end cost in the same GCP zone.
With n1-standard-96 priced at $4.56/hr and n1-standard-4 at $0.19/hr and T4 at $0.35/hr totaling $0.54/hr. While achieving a much lower latency, the TCO of BERT inference with TensorRT on T4 is over 163 times that of Distill BERT inference on n1-standard-96.
NVIDIA Triton Inference Server, running on GKE with GPU and TensorRT, provides a cost-effective and high-performance foundation to build an enterprise-scale, shared-service ML inference platform. We also introduced the One-Click Triton Inference Server solution to help jumpstart ML inference projects. Finally, we provided a few recommendations that will help you get a GPU-enabled inference project off the ground:
Use TensorRT to optimize Deep Learning model inference performance.
Leverage concurrent serving and dynamic batching features in Triton.
To take full advantage of the newer GPUs, use FP16 or INT8 precision for the TensorRT models.
Use Model Priority to ensure latency SLO compliance for Tier-1 models.
Cheaper Cloud AI deployments with NVIDIA T4 GPU price cut
Efficiently scale ML and other compute workloads on NVIDIA’s T4 GPU, now generally available
New Compute Engine A2 VMs—first NVIDIA Ampere A100 GPUs in the cloud
Turbocharge workloads with new multi-instance NVIDIA GPUs on GKE
Mitigating transient load effects on ML serving latency
Acknowledgements: David Goodwin, Principal Software Engineer, NVIDIA; Mahan Salehi, Triton Product Manager, NVIDIA; Jill Milton, Senior Account Manager, NVIDIA; Dinesh Mudrakola, Technical Solution Consultant, GCP and GKE Marketplace Team
Read More for the details.
Following the announcement of updates to the PostgreSQL database by the open source community, we have updated Amazon Aurora PostgreSQL-Compatible Edition to support PostgreSQL versions 9.6.22, 10.17, 11.12, and 12.7. These releases contain bug fixes and improvements by the PostgreSQL community. As a reminder, Amazon Aurora PostgreSQL 9.6 will reach end of life on January 31, 2022. Minor version 9.6.22 is limited to upgrades for clusters already running Aurora PostgreSQL 9.6.
Read More for the details.
Amazon Aurora PostgreSQL-Compatible Edition now supports the oracle_fdw extension, which allows your PostgreSQL database to connect to and retrieve data stored in Oracle databases.
Read More for the details.
We are introducing Amazon SageMaker Asynchronous Inference, a new inference option in Amazon SageMaker that queues incoming requests and processes them asynchronously. This option is ideal for inferences with large payload sizes (up to 1GB) and/or long processing times (up to 15 minutes) that need to be processed as requests arrive. Asynchronous inference enables you to save on costs by autoscaling the instance count to zero when there are no requests to process, so you only pay when your endpoint is processing requests.
Read More for the details.
?Prefer to listen? Check out this episode on the Google Cloud Reader podcast
If you’re anything like me, you love reading, but also appreciate that sometimes your eyes need to be doing other things; whether it’s finding your exit off the highway, or keeping your puppy from destroying the couch.
And sometimes the thought of sitting down to read something just feels like it’s going to take valuable multi-tasking time away from my day. I know, I know, multitasking can be frowned upon, but it’s the way I live a good chunk of my life, and it’s working out so far. And while I’m not alone in my multitasking, I’m also not alone in my desire for a non-visual way to get this content, or any content.
*Google Cloud Reader enters the chat*
Google Cloud Reader is a podcast that lets you listen to the Google Cloud Blog posts that aren’t as dependent on visuals. This means they’re articles that are, or are adapted to be, less focused on graphs, or code samples, and instead describe the meaning behind those visual aids.
It’s an easy, audible way to absorb content around all things new in Cloud, while still being able to make sure Ruthie doesn’t eat my work from home equipment.
Ruthie, a French Shepherd puppy, with her giant ears and feet dangerously close to filming equipment
So by now you’re probably thinking “OK, so you started a podcast during the pandemic, even though you definitely seemed like the type to start making sourdough”—and you’re right. My 53 plants agree with you. But rest assured, one can listen to an episode of this podcast *while* creating a macramé plant hanger, or waiting for bread to rise—multitasking, am I right?
We’re a little over 50 episodes/macrame plant hangers in, so you should check it out (Ruth and I would appreciate it).
Beginners Guide to Painless Machine Learning – Learn how to get started with Google Cloud AI tools
Introducing GKE Autopilot: A Revolution in Managed Kubernetes – Learn more about GKE Autopilot, a revolutionary mode of operations for managed Kubernetes that lets you focus on your software, while GKE Autopilot manages the infrastructure.
Cook up your own ML recipes with AI Platform – Learn about Mars Wrigley’s new ML-inspired recipe experiment on Google Cloud and how you can get started with your own.
Recovering Global Wildlife Populations using ML – Review Google’s Wildlife Insight’s ML project and help users create an image classification model for motion-sensor cameras (called camera traps) used to help protect wildlife in an non-invasive way by collecting and tagging species via pictures.
Let me know your favorite episodes, and what other articles you’d like to hear on Twitter @jbrojbrojbro!
No matter why you prefer an audio format, we’ve got you covered; Google Cloud Reader, where we read the tech blog for you, and to you.
Get all the Google Cloud Reader on your favorite podcast platform, including Google Podcasts, Apple Podcasts, and Spotify.
Read More for the details.
Developers use the gRPC RPC framework for use cases like backend service-to-service communications or client-server communications between web, mobile and cloud. In July 2020, we announced support for proxyless gRPC services to reduce operational complexity and improve performance of service meshes with Traffic Director, our managed control plane for application networking. Then, in August we added support for advanced traffic management features such as route matching and traffic splitting. And now, gRPC services can be configured via theTraffic Director control plane to use TLS and mutual TLS to establish secure communication with one another. In this blog post we will talk about why this feature is important and the steps needed to get started.
As a general-purpose RPC framework, gRPC was developed as an open-source and HTTP/2-based version of a communication protocol that was used at Google internally. Today gRPC is used by more than one thousand organizations worldwide.
gRPC supports a variety of use-cases and deployment models—the above-mentioned communication between backend services, or by different clients to access Google Cloud services. gRPC supports multi-language environments; for example, it enables a Java client to talk to a server written in the Go language.
gRPC is implemented on top of HTTP/2 and mainly uses protobuf as the serialization/deserialization mechanism (but can use alternative mechanisms). The combination of the two provides organizations with a solid RPC framework that addresses their emerging problems as they scale:
Support for multiple languages
Support for automatic client library generation, which increases agility by reducing the amount of boilerplate code
Protobuf support for evolving message definitions (backward compatibility) and providing a single source of truth
HTTP/2’s binary framing for efficiency and performance
HTTP/2’s support for concurrent streams and bi-directional streaming
gRPC has an important role to play in today’s microservices-based architectures. When big monolithic applications are broken down into smaller microservices, in-process calls between components of the monolith are transformed into network calls between microservices. gRPC makes it easy for services to communicate, both because of the benefits we talked about in the previous section and also because of the support for xDS protocol that we added last year.
Microservices-based applications require a service-mesh framework to provide load balancing, traffic management and security. By adding xDS support to gRPC, we enabled any control plane that supports xDS protocols to talk directly to a gRPC service, to provide it with service mesh policies.
The first launch we did in the summer of 2020 enabled gRPC clients to process and implement policies for traffic management and load balancing. The load balancing is happening on the client side so you won’t need to change your gRPC servers at all. It officially supports Traffic Director as a control plane. The second launch last year enabled fine-grained traffic routing, and weight-based traffic splitting.
But how do we make the network calls as secure as intra-process calls? We would need to use gRPC over TLS or mTLS. That’s where security in service mesh comes in. The latest version of gRPC allows you to configure policies for encrypted service-to-service communications.
Historically enterprises have used web application firewalls (WAFs) and firewalls at their perimeters to protect their services, databases and devices against external threats. Over time, with the migration of their workloads to cloud, running VMs and containers and using cloud services, security requirements have also evolved.
In a defense-in-depth model, organizations maintain their perimeter protection using firewalls and web application firewalls for the whole app. Today, on top of that, organizations want a “zero trust” architecture where additional security policy decisions are made and enforced as close to resources as possible. When we talk about resources, we are talking about all enterprise assets—everything in an organization’s data center.
Organizations now want to be able to enforce policies, not just at the edge, but also between their trusted backend services. They want to be able to apply security rules to enable encryption for all the communications and also rules to control access based on service identities and Layer-7 headers and attributes.
The solution we are proposing today solves the most common pain points for establishing security between services, including:
Managing and installing certs on clients and servers
Managing trust bundles
Tying identities and issuing certificates from a trusted CA
Rotating certificates
Modifying code to read and use the certificates
Imagine a world where your infrastructure provides workload identities, CAs and certificate management tied to those workload identities. In addition, workload libraries are able to utilize these facilities in its service mesh communication to provide service-to-service TLS/mTLS and authorization. Just think how much time your developers and administrators would save!
By configuring gRPC services via Traffic Director, you have all the necessary tools to establish security in an automated fashion between your services. Simply configure a security policy for your client and server, and Traffic Director distributes it to your services. A GKE workload certificate service generates the appropriate SPIFFE ID and creates a CSR (Certificate Signing Request) to the Google Cloud Certificate Authority (CA) Service, a managed private CA. CA Service signs the CSR and issues the certificates. And finally, GKE’s certificate provider makes the signed certificates available to the gRPC application via a “certificate volume” which gets used to encrypt and authenticate the traffic between your services.
In summary, using the new security features, you get the following benefits:
Toil-free provisioning of keys and certificates to all services in your mesh
Added security because of automatic rotation of keys and certificates
Integration with GKE including capabilities such as deployment descriptors, and labels
High availability of Google managed services such as Traffic Director and CA Service for your service mesh
Security tied to Google Identity & Access Management, for services authorization based on authorized Google service accounts.
Seamless interoperability with Envoy-based service meshes; for example, a service can be behind an Envoy proxy but the client uses gRPC proxyless service mesh security or vice versa
Next up, look for us to take security one step further by adding authorization features for service-to-service communications for gRPC proxyless services, as well as to support other deployment models, where proxyless gRPC services are running somewhere other than GKE, for example Compute Engine. We hope you’ll join us and check out the setup guide and give us feedback.
Read More for the details.
In April 2021, IAM Access Analyzer added policy generation to help you create fine-grained policies based on AWS CloudTrail activity stored within your account. Now, we are extending policy generation to enable you to generate policies based on access activity stored in a designated account. For example, you can use AWS Organizations to define a uniform event logging strategy for your organization and store all CloudTrail logs in your management account to streamline governance activities. IAM Access Analyzer helps you by reviewing access activity stored in your designated account and generates a fine-grained IAM policy in your member accounts. This helps you to easily create policies with just the required permissions for your workloads.
Read More for the details.
Transition to new release annotations without using API keys in Application Insights.
Read More for the details.
Migrate to HPC, GP, or RAM optimized VMs by 31 August 2022
Read More for the details.
Transition to Tomcat 8.5 or 9.0 by 29 July 2022.
Read More for the details.
Update your Azure Cosmos DB .NET SDK to version 3 by 31 August 2024.
Read More for the details.
Transition to new HPC virtual machines by 31 August 2022.
Read More for the details.
We’re excited to announce that Amazon Forecast Weather Index is now also available in the Asia-Pacific region. Weather Index can increase your forecasting accuracy, by automatically including the latest local weather information in your demand forecasts with one click and at no extra cost. Weather conditions influence consumer demand patterns, product merchandizing decisions, staffing requirements and energy consumption needs – however – acquiring, cleaning, and effectively using live weather information for demand forecasting is challenging and requires ongoing maintenance. With this launch, customers who have been using Weather Index in the US, Canada, South America and Europe, can now, with one click to your demand forecast, also include 14-day weather forecasts for Asia-Pacific.
Read More for the details.
Late last year, we announced that Artifact Registry was going GA, allowing GCP customers to manage their packages within the same platform as they were being deployed. In this blogpost, we want to show you how to do exactly that with a private dependency.
Private dependencies allow your packages to be shared with only a select group of viewers. If your codebase is already private, a private dependency can help modularize functionality using the same methodologies you use in your open source projects. Furthermore, you can experimentally develop your private dependency without breaking your overall codebase by pinning the version of the dependency on a working release. It can also provide necessary and durable abstraction if multiple projects depend on the same functionality. It does so by allowing multiple teams access to up-to-date and tested code rather than relying on copying and pasting fragmented code snippets.
With Artifact Registry, you can now wire together your serverless processes with your private dependencies without ever leaving Google Cloud Platform. This blogpost will discuss one example of how you can host your private dependency and later deploy to a serverless host like Google Cloud Functions using Cloud Build to automate the deployment.
Before getting started, take a look at the sample code here to copy and follow along.
Let’s walk through deploying a Google Cloud Function with a simple private dependency written in Node. Our example dependency will return the input given in unicode. It’s index.js file will look like this:
First, you’ll want to prepare your package to upload to Artifact Registry. For Node, this package should have a package.json file, which should dictate the entry point and information about the package. You can create a simple one like the one below by running the command npm init -y.
For the name of the package you should specify your scope. A scope allows you to group packages, which is helpful if you want to publish a private package; alternatively, publishing without a scope would make the repository public by default. In this blogpost, we’re going to use the scope @example, but you should name it after your private dependency’s group (i.e., your company, team or project).
Another important detail in this file is that the devDependencies property contains the dependency for authenticating to the google artifact registry. To authenticate, you will use the command in the scripts section later in this tutorial.
Follow the instructions on these guides for creating an npm package repository on Artifact Registry, without configuring npm or pushing the repository. Next, you’ll want to configure the .npmrc file. To do so, simply add an empty file titled .npmrc, which should live at the base of your repository. To configure this file to deploy to the registry you just created, run the following command, and add the output to the .npmrc file. (Note: you may need to install the Google Cloud SDK before running the command.)
gcloud alpha artifacts print-settings npm –scope=@example
–repository=blog-repo –location=”us-central1”
Copy that output into your .npmrc file. Ultimately, it should look like this, substituting <projectId> for your Google Cloud Platform project ID.
Then, you can push the package to the artifact repository. To do so, run this command (ensuring that you’ve copied the scripts portion from the package.json file above):
npm run artifactregistry-login <path to your .npmrc file>
This command allows you to refresh your access token when pushing your repository.
Then, simply publish by running:
npm publish
You can confirm you’ve deployed your library by searching for the repo in Artifact Registry in your Google Cloud Platform dashboard.
Once you have set up a repository in Artifact Registry, you can start to build your applications on top of it. Take a simple serverless example, like a Google Cloud Function:
This simple Cloud Function uses our private dependency to print out “Hello World” to the specified URL in unicode (it actually uses the same example in this tutorial). But how will Cloud Function successfully pull the private dependency? By using the .npmrc file you created in your original repository.
To see it in action, follow instructions for creating a simple Google Cloud Function. You can follow the tutorial exactly, ensuring that the following three key elements are in your function:
When you create the index.js file (as done in the tutorial), it should live at the base of the repository, and should use the private dependency you’ve set up in artifact registry (like the example above),
Its package.json should list:
Your dependency with the version as listed in Artifact Registry
A script to authenticate with artifact registry (just as for your dependency)
And, most importantly, you should copy over your .nmprc file to the base of this Google Cloud Function to authenticate your npmrc token.
Then, you can deploy the function using the following command:
gcloud functions deploy mygcf –runtime nodejs12 –trigger-http –allow-unauthenticated
To see it in action, simply follow the http trigger link (from the tutorial) and check out your input in unicode.
The command above will deploy the function, but it does so by exposing your token in your .npmrc file, and by forcing you to manually re-authenticate each time you redeploy the function. To automate the redeployment of the function in a safe manner, you can add a cloudbuild.yaml file to the root of your Cloud Function package.
First, let’s start by creating a helper function to modify the .npmrc file. You should save the following file to the root of your Cloud Function package, and name it npmrc-parser.js:
Next, let’s create the file cloud build file. To do so, copy the following file in the root of your directory, and title it cloudbuild.yaml:
The first two steps of the build file will authenticate your private dependency, and install all dependencies on the project. The third step will call the custom helper function we created above to prepare your .npmrc file. This function takes two arguments, pathToAuthToken, and pathToNpmrc. The pathToAuthToken is the left-hand side of the authToken assignment in your .npmrc file. It should look something like this, replacing projectId with your own project:
“//us-central1-npm.pkg.dev/<projectId>/blog-repo/:_authToken”
The pathToNpmrc would be wherever you’ve saved your .npmrc file. In this case, the value would look like so:
“.npmrc”
This build step removes the token value on the file and saves it to a variable, and replaces the .npmrc file with the environment variable TOKEN. So, the Cloud Function never stores the actual token in the source code, and the .npmrc file that is saved locally looks like this:
@example:registry=https://us-central1-npm.pkg.dev/<projectId>/blog-repo/
//us-central1-npm.pkg.dev/<projectId>/blog-repo/:_authToken=””
//us-central1-npm.pkg.dev/<projectId>/blog-repo/:always-auth=true
The last step in the build file redeploys the function, replacing the environment variable in the .npmrc file with the token value we just created. To run the build steps, you can set up a trigger, or run the following command manually, replacing the variables as we’ve described above:
gcloud builds submit –config=cloudbuild.yaml –substitutions=_PATHTOTOKEN=”<PATHTOTOKEN>”,_PATHTONPMRC=”<PATHTONPMRC>”,_FUNCTIONNAME=”<CLOUDFUNCTIONNAME>”
Before running, make sure you’ve set the appropriate permissions for your Cloud Build function.
That’s all there is to it! Once set up this way, your Google Cloud Function can pull in your private dependency from Artifact Registry without hosting on any external package managers, and without any manual deployment steps.
To speed up the deployment of your local package to Artifact Registry, you can also add a Cloud Build file to your Artifact Registry package that will trigger a publishing event when changes are saved to your package. You can follow the setup steps here, but here is a snippet of a sample cloudbuild.yaml file that would live in your private dependency:
Even though this blog post focuses on Node.js, Cloud Functions and Artifact Registry support other runtimes as well, like Python and Java. For example, with Python the steps for deploying the module to Python aren’t much more complicated than Node. Once you’ve readied your private dependency and published to Artifact Registry, you can start creating a Google Cloud Function like the one above, but in Python. Next, you will want to fetch and package these dependencies locally.
Read More for the details.
Inevitably, in the lifetime of a service or application, developers, DevOps, and SREs will need to investigate the cause of latency. Usually you will start by determining whether it is the application or the underlying infrastructure causing the latency. You have to look for signals that indicate the performance of those resources when the issue occured.
In most instances, the signals that provide the richest information for latency are traces. Traces represent the total time it takes for a request to propagate through every layer of a distributed system, including the load balancer, computes, databases and more during execution. The subset of traces used to represent each layer of the execution are referred to as spans.
The difficulty of generating traces has prevented many users from accessing this useful troubleshooting resource. To make them more easily available to developers, we’ve started instrumenting our most popular serverless compute options, AppEngine, Cloud Run and Cloud Functions to generate traces by default. While this will not provide the full picture of what is going on in a complex distributed system, it will provide crucial pieces of information needed to decide which area to focus on during troubleshooting.
The simple answer is, nothing! Once your code is deployed in any serverless compute like AppEngine, Cloud Run or Cloud Functions, any ingress or egress traffic through the compute automatically generates spans that are captured and stored in Cloud Trace. These spans are stored for 30 days at no additional cost. See additional terms here. The resulting traces can be visualized as waterfall graphs with representative values of latency. In addition, we have extended this capability to Google Cloud databases, with Cloud SQL Insights generating traces representative of query plans for PostgreSQL and sending them to Cloud Trace.
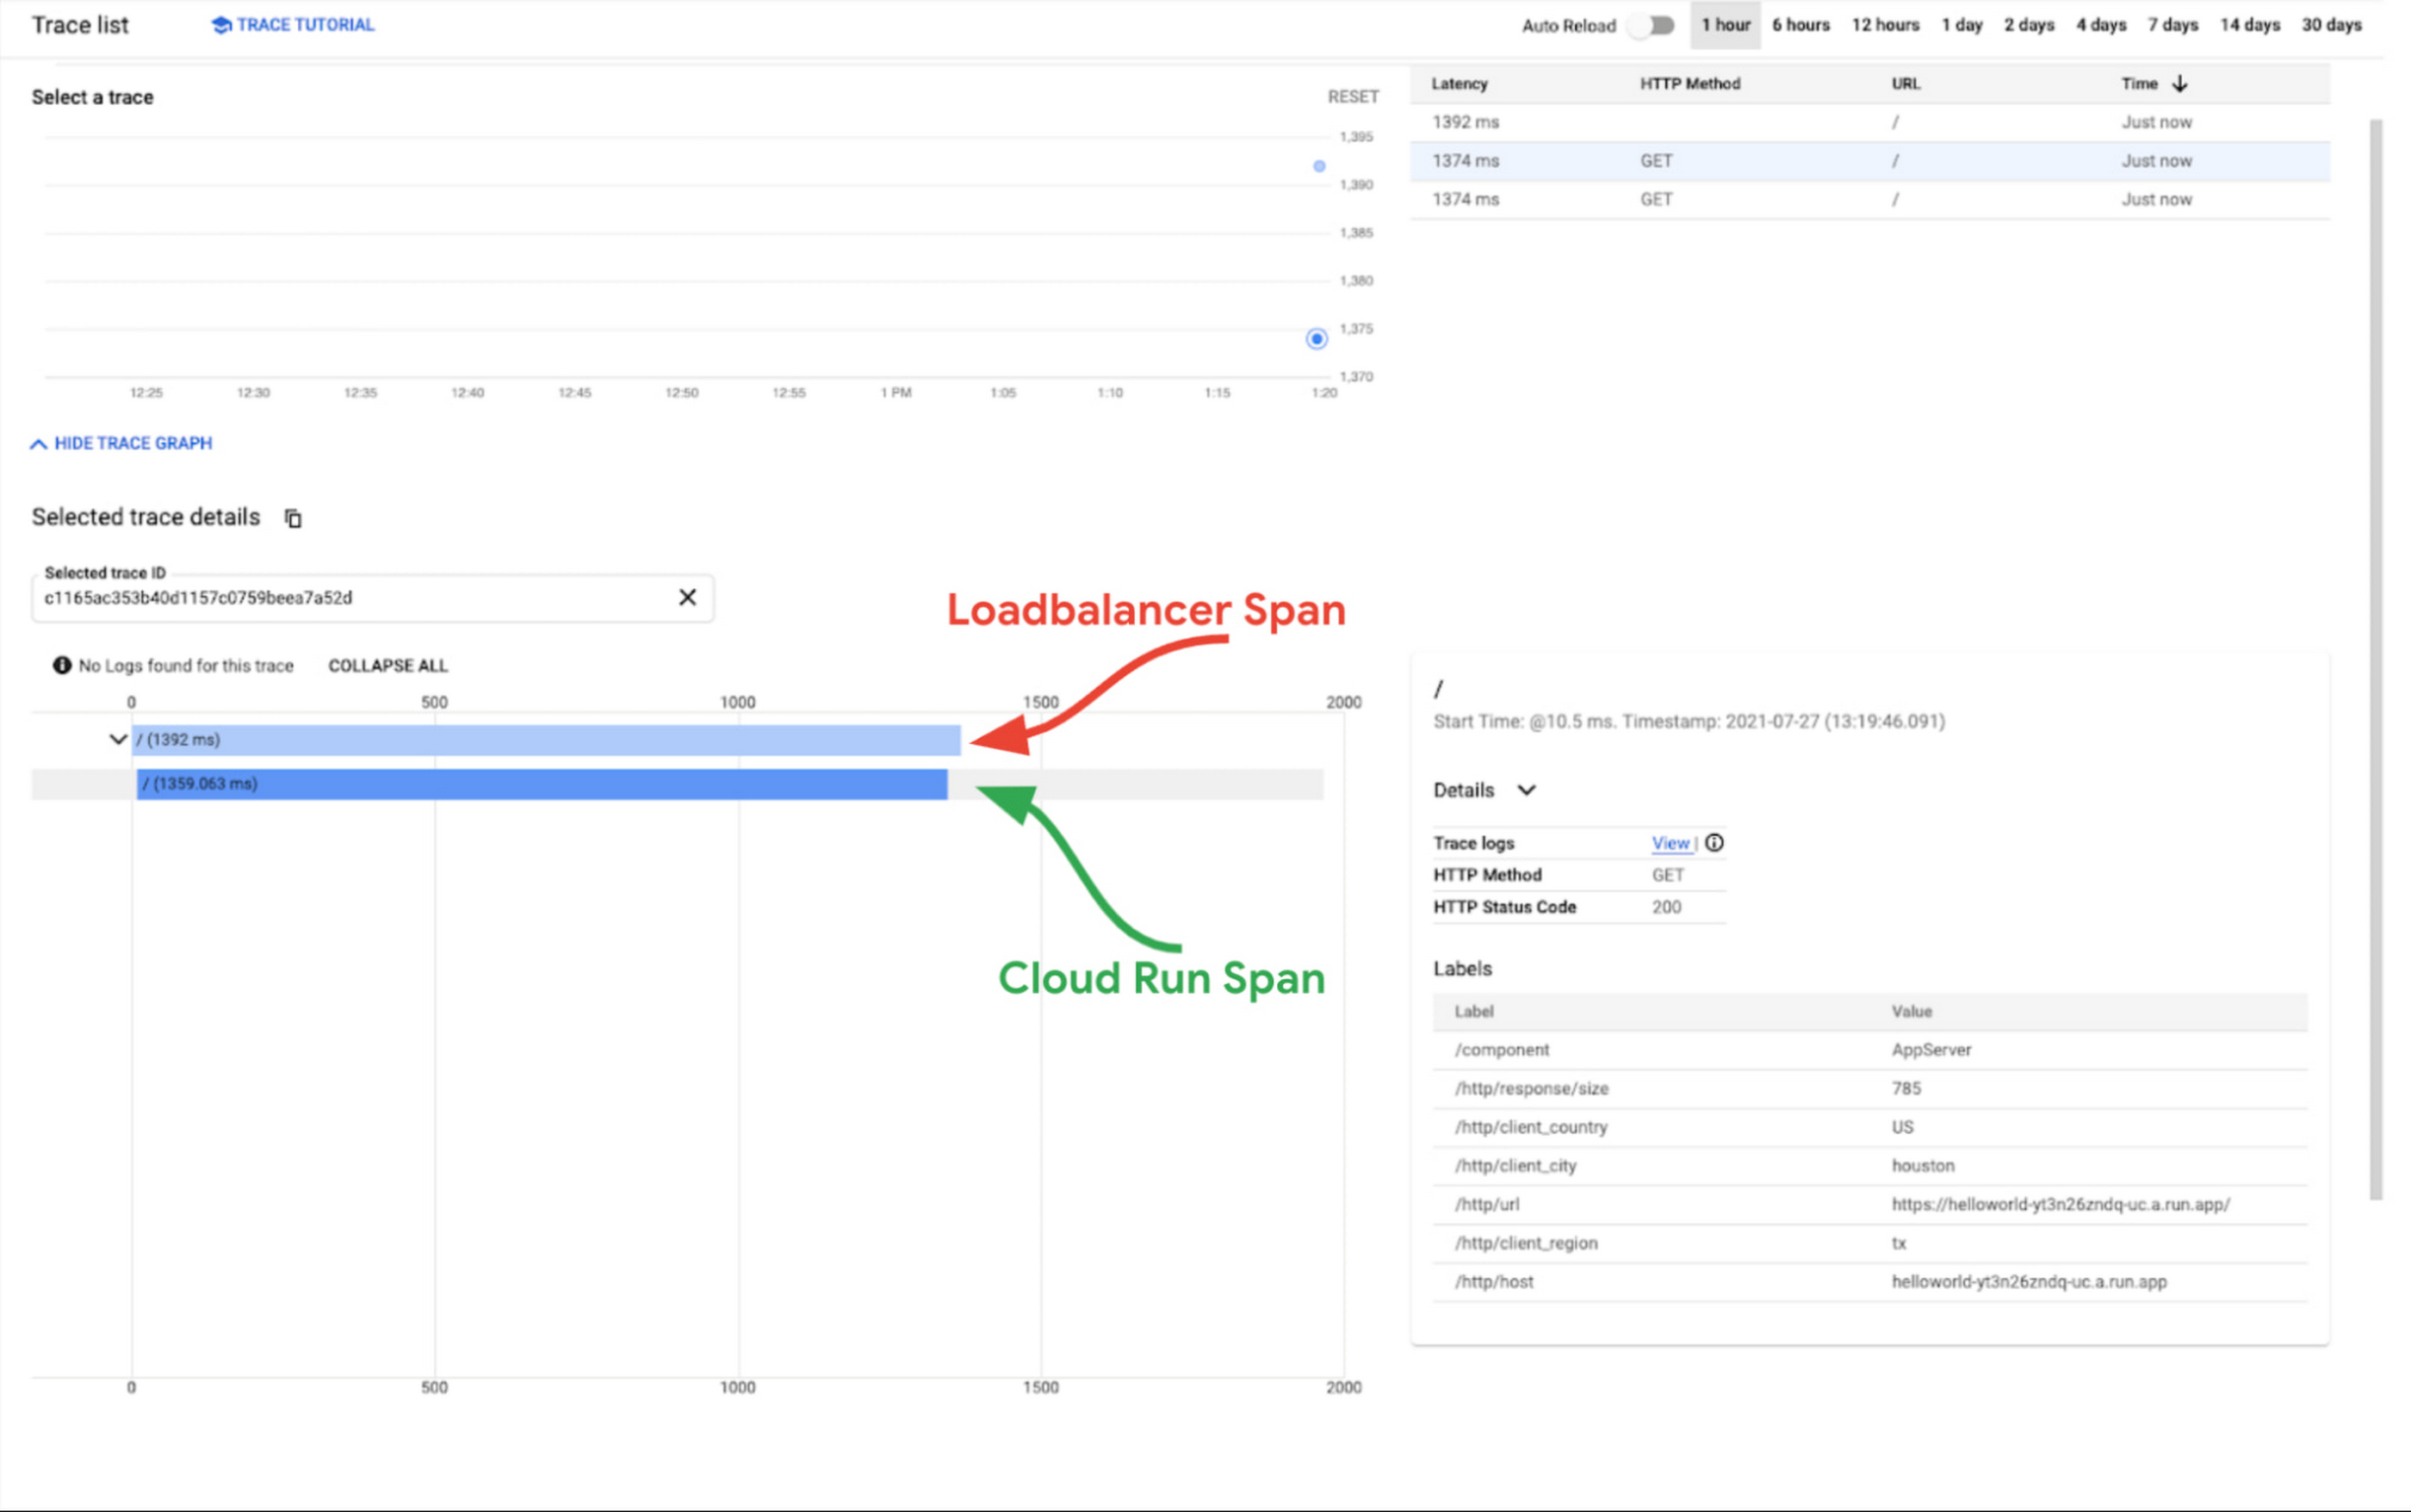
The screenshot below is a Day 1 trace captured from a simple “Helloworld” application deployed in Cloud Run. The load balancer span (i.e. root span) is indicative of the total time through Google Cloud’s infrastructure and the Cloud Run span is indicative of the time it took for the compute to execute and service the request.
As you can see in the graphic below, the loadbalancer span is roughly equal to the Cloud Run span, so we can conclude that any observed latency is not being caused by Google’s infrastructure. At this point you can focus more on your code.
You must still instrument your application if you want it to generate more granular spans representative of the code’s execution. You can start here to pick the library that matches your development language and for instructions on how to instrument your code. Once this is done, your traces will get richer, encompassing more spans with information about both the performance of the infrastructure and application in one single waterfall view.
We are excited about the future of telemetry in Google Cloud. Upcoming releases in the next six months will touch on infrastructure instrumentation and areas like trace analysis, metrics, integrations to other Google Cloud products and integrations with third party APM products.
Explore the traces from your infrastructure in your Cloud Trace console and explore the available libraries and procedures for application instrumentation. If you have questions or feedback about this new feature, head to the Cloud Operations Community page and let us know!
Read More for the details.