Managing container images effectively is crucial for modern application development and deployment, especially in Cloud environments. Popular tools like Docker are commonly used to pull, push, and inspect container images. However, the reliance on a running daemon can be a drawback for CI/CD pipelines or straightforward tasks like image inspection. Enter Skopeo, a versatile command-line utility designed to work with container images and registries without needing a daemon.
Let’s explore 5 key ways Skopeo can simplify and enhance your container image workflows within the Google Cloud ecosystem. This will focus on interactions with Artifact Registry, Google Cloud’s fully managed service for storing, managing, and securing container images and other packages.
What is Skopeo?
Skopeo is an open-source command-line tool specifically designed for operating on container images and image repositories. Its primary advantage lies in its daemonless operation; unlike the standard Docker client, it doesn’t require a background Docker daemon to function. Even in an environment like Google Cloud Build where a Docker daemon is available, this provides a key benefit: Skopeo can interact directly with container registries. This avoids the overhead of first pulling an image to the build worker’s local Docker storage, making tasks like copying an image between two Artifact Registry repositories a more efficient, direct registry-to-registry transfer.
Why use Skopeo with Google Cloud?
Skopeo becomes particularly powerful when paired with Google Cloud services:
-
Artifact registry management: Easily inspect, copy, and manage images within your Artifact Registry repositories.
-
Efficient image migration and copying: Seamlessly copy images between different Artifact Registry repositories (for example, promoting dev to prod), pull images from external public or private registries (like Docker Hub) into Artifact Registry, or even mirror external registries into your private Artifact Registry for security and availability.
-
Efficient inspection: Inspect image metadata (layers, labels, digests, environment variables, creation date) in Artifact Registry without pulling the entire image, saving significant time and bandwidth, especially in automation.
-
CI/CD integration: Integrate Skopeo into Cloud Build pipelines or other CI/CD systems (like Jenkins running on Compute Engine or Google Kubernetes Engine (GKE)) for automated, daemonless image handling.
-
Scripting: Its command-line nature makes it perfect for scripting image management tasks and cleanup routines.
Setting up your environment
Before diving into the commands, ensure you have the necessary tools and configuration:
Prerequisites:
Set Environment Variables
First, define some environment variables in your shell session to simplify the commands. Replace the placeholder values with your specific details:
- code_block
- <ListValue: [StructValue([(‘code’, ‘export PROJECT_ID=”your-gcp-project-id”rnexport REGION=”us-central1″rnexport REPO_NAME=”my-containers”rnexport SOURCE_IMAGE=”docker.io/library/nginx:stable-alpine”rnexport IMAGE_NAME=”nginx”rnexport IMAGE_TAG=”stable-alpine”‘), (‘language’, ”), (‘caption’, <wagtail.rich_text.RichText object at 0x3e48ce847850>)])]>
Configure Authentication
Next, configure gcloud to authenticate Docker (which Skopeo uses) with Artifact Registry in your chosen region. This allows Skopeo to push and pull images from your private registry.
- code_block
- <ListValue: [StructValue([(‘code’, ‘gcloud auth configure-docker “${REGION}-docker.pkg.dev” –quiet’), (‘language’, ”), (‘caption’, <wagtail.rich_text.RichText object at 0x3e48ce847f40>)])]>
Create Artifact Registry Repository (if needed)
Ensure the Artifact Registry repository exists. If you haven’t created it yet, use the following command, replacing the variables with the values from the “Set Environmental Values” section of this post:
- code_block
- <ListValue: [StructValue([(‘code’, ‘gcloud artifacts repositories create “${REPO_NAME}” \rn –repository-format=docker \rn –location=”${REGION}” \rn –description=”Skopeo test repository” \rn –project=”${PROJECT_ID}”‘), (‘language’, ”), (‘caption’, <wagtail.rich_text.RichText object at 0x3e48ce847fa0>)])]>
With these steps completed, your environment is ready to use Skopeo with Artifact Registry.
Skopeo use cases with Google Cloud
With authentication configured and environment variables set using the script above, let’s walk through common scenarios using the popular nginx image to illustrate 5 specific ways Skopeo streamlines workflows. The following commands use the variables like $PROJECT_ID, $REGION, $REPO_NAME, etc., that you just defined.
Our scenario: Imagine your organization relies on the official nginx image. To ensure stability, security, and compliance, you want to bring external dependencies like this into your own managed Artifact Registry. This allows you to control distribution internally, scan images with Google Cloud security tools, and prevent issues related to external registry rate limits or availability.
Here’s how Skopeo helps achieve this, step-by-step:
1. Inspecting the source image (Verification) Before importing an external image, it’s crucial to verify its contents and metadata. Is it the official image? What architecture does it support? Does it have expected labels or exposed ports? Inspecting without pulling saves time and bandwidth, especially in automated pre-flight checks.
- code_block
- <ListValue: [StructValue([(‘code’, ‘# Inspect the SOURCE_IMAGE on Docker Hubrnskopeo inspect “docker://${SOURCE_IMAGE}”‘), (‘language’, ”), (‘caption’, <wagtail.rich_text.RichText object at 0x3e48ce5cc130>)])]>
Result: JSON output confirming details like layers, architecture, digest, and creation date.
If the command above fails with an architecture mismatch error like “no image found in image index for architecture…”, it’s because the image doesn’t have a manifest specifically for your host OS/architecture (e.g., macOS on ARM64). Skopeo defaults to matching your host. To resolve this, specify a target platform that is available in the image, like linux/amd64 or linux/arm64, using --override-os and --override-arch as shown in the following alternative command:
- code_block
- <ListValue: [StructValue([(‘code’, ‘# Alternative: Inspect specifying a common platform (e.g., linux/amd64) if the above failsrnskopeo inspect –override-os linux –override-arch amd64 “docker://${SOURCE_IMAGE}”‘), (‘language’, ”), (‘caption’, <wagtail.rich_text.RichText object at 0x3e48ce46c0d0>)])]>
Result: JSON output confirming details for the specified linux/amd64 platform.
2. Copying the image to Artifact Registry (Internalization & Control) Copying the verified image into your private Artifact Registry is crucial for taking control of its distribution and management. Using the --all flag ensures that the entire manifest list and all associated architecture-specific images are copied, making all supported platforms available internally. This internal copy becomes the canonical source for your organization’s builds and deployments, ensures consistent availability, allows integration with internal security scanning (like Artifact Analysis), and avoids external registry dependencies during critical operations.
- code_block
- <ListValue: [StructValue([(‘code’, ‘# Copy the SOURCE_IMAGE with ALL architectures to your Artifact Registryrnskopeo copy –all “docker://${SOURCE_IMAGE}” \rn “docker://${REGION}-docker.pkg.dev/${PROJECT_ID}/${REPO_NAME}/${IMAGE_NAME}:${IMAGE_TAG}”‘), (‘language’, ”), (‘caption’, <wagtail.rich_text.RichText object at 0x3e48ce48b850>)])]>
Output: Shows the manifest list and associated images being efficiently transferred to your secure, managed registry.
3. Listing available image tags in Artifact Registry (Confirmation) After copying, you need to confirm that the image and the specific tag (stable-alpine in this case) are now available within your internal registry. This step is essential for validating CI/CD pipeline steps or simply ensuring the image is ready for internal consumption.
- code_block
- <ListValue: [StructValue([(‘code’, ‘# List tags for the IMAGE_NAME within your REPO_NAME to confirm the copyrnskopeo list-tags “docker://${REGION}-docker.pkg.dev/${PROJECT_ID}/${REPO_NAME}/${IMAGE_NAME}”‘), (‘language’, ”), (‘caption’, <wagtail.rich_text.RichText object at 0x3e48ce48b7c0>)])]>
Result: A list of tags for nginx in your repository, which should now include stable-alpine.
4. Copying Between Artifact Registry Repositories (Promotion) A common workflow is promoting images between different environments (e.g., dev to prod). Skopeo makes it easy to copy images between repositories within Artifact Registry. Assuming you have another repository, say prod-containers, you can copy the image there. Using --all ensures all architectures are copied.
Note: You would need to create the prod-containers repository first using a similar gcloud artifacts repositories create command as shown in the setup.
- code_block
- <ListValue: [StructValue([(‘code’, ‘# Define the destination “prod” repository and image pathrnexport PROD_REPO_NAME=”prod-containers” # Example name, ensure this repo existsrnexport DEST_IMAGE_AR=”docker://${REGION}-docker.pkg.dev/${PROJECT_ID}/${PROD_REPO_NAME}/${IMAGE_NAME}:${IMAGE_TAG}”rnexport SOURCE_IMAGE_AR=”docker://${REGION}-docker.pkg.dev/${PROJECT_ID}/${REPO_NAME}/${IMAGE_NAME}:${IMAGE_TAG}”rnrn# Copy the image with ALL architectures from the source AR repo to the prod AR repornskopeo copy –all “${SOURCE_IMAGE_AR}” “${DEST_IMAGE_AR}”‘), (‘language’, ”), (‘caption’, <wagtail.rich_text.RichText object at 0x3e48cc493850>)])]>
Output: Shows the manifest list and associated images being efficiently transferred between your Artifact Registry repositories.
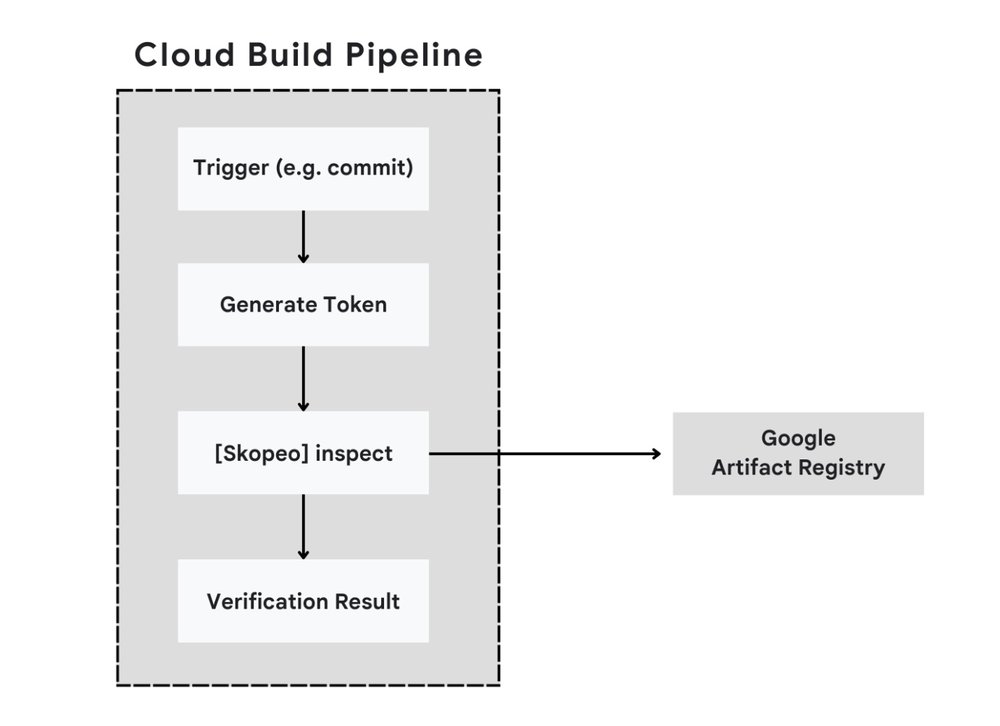
5. Verifying the Promoted Image with Cloud Build (Automated Verification) After promoting an image (as in step 4), automated verification is crucial in CI/CD pipelines. Instead of manual inspection, we can use Cloud Build with Skopeo to programmatically verify the image exists and is accessible in the destination repository (e.g., prod-containers). This demonstrates integrating Skopeo into an automated workflow.
5a. Grant Permissions: Grant the necessary roles/artifactregistry.reader role to your project’s Cloud Build service account for the production repository.
- code_block
- <ListValue: [StructValue([(‘code’, ‘# Get the project number (needed for the service account email)rnexport PROJECT_NUMBER=$(gcloud projects describe “${PROJECT_ID}” –format=’value(projectNumber)’)rnexport CLOUD_BUILD_SA_EMAIL=”${PROJECT_NUMBER}@cloudbuild.gserviceaccount.com”rnrn# Grant the Artifact Registry Reader role to the Cloud Build SA for the PROD reporngcloud artifacts repositories add-iam-policy-binding “${PROD_REPO_NAME}” \rn –location=”${REGION}” \rn –member=”serviceAccount:${CLOUD_BUILD_SA_EMAIL}” \rn –role=”roles/artifactregistry.reader” \rn –project=”${PROJECT_ID}” –quiet’), (‘language’, ”), (‘caption’, <wagtail.rich_text.RichText object at 0x3e48cc493280>)])]>
5b. Create Cloud Build Configuration: Create a cloudbuild.yaml file with the following steps.
Note: This build uses Skopeo to inspect the image, authenticating via a short-lived token generated from the build service account’s credentials.
- code_block
- <ListValue: [StructValue([(‘code’, ‘steps:rn- name: ‘quay.io/skopeo/stable:latest’ # Using an official Skopeo imagern entrypoint: ‘bash’rn args:rn – ‘-c’rn – |rn echo “Attempting skopeo inspect on promoted image…”rn AR_TOKEN=$$(curl -s -H “Metadata-Flavor: Google” -v “http://metadata.google.internal/computeMetadata/v1/instance/service-accounts/default/token” | sed -n ‘s/.*”access_token”:”\([^”]*\)”.*/\1/p’)rn # Use –override flags as Skopeo runs in a Linux containerrn skopeo inspect –registry-token “$${AR_TOKEN}” \rn –override-os linux \rn –override-arch amd64 \rn “docker://${_REGION}-docker.pkg.dev/${PROJECT_ID}/${_PROD_REPO_NAME}/${_IMAGE_NAME}:${_IMAGE_TAG}”rn id: ‘Inspect-Promoted-Image’rn# Define substitutions required by the build stepsrn# These will be populated by the gcloud builds submit commandrnsubstitutions:rn _PROD_REPO_NAME: ‘prod-containers’rn _IMAGE_NAME: ‘nginx’rn _IMAGE_TAG: ‘stable-alpine’rn _REGION: ‘us-central1”), (‘language’, ”), (‘caption’, <wagtail.rich_text.RichText object at 0x3e48cc493250>)])]>
Note: Ensure you have this cloudbuild.yaml file in your current directory or specify its path when submitting the build.
5c. Trigger the Cloud Build: Execute the following command to submit the build. Note that this command uses the shell variables (like $PROD_REPO_NAME, $IMAGE_NAME, etc.) defined earlier in the setup section to provide values for the Cloud Build substitutions (which must start with _).
- code_block
- <ListValue: [StructValue([(‘code’, ‘gcloud builds submit . –config cloudbuild.yaml \rn –substitutions=_PROD_REPO_NAME=”${PROD_REPO_NAME}”,_IMAGE_NAME=”${IMAGE_NAME}”,_IMAGE_TAG=”${IMAGE_TAG}”,_REGION=”${REGION}” \rn –project=”${PROJECT_ID}”‘), (‘language’, ”), (‘caption’, <wagtail.rich_text.RichText object at 0x3e48cc493cd0>)])]>
Result: The Cloud Build logs will show the output of the skopeo inspect command, confirming the image details in the production repository. A successful build indicates the image is present and accessible.
These 5 steps illustrate how Skopeo, from simple inspection to integration within automated Cloud Build workflows, streamlines essential container image management tasks in Google Cloud, particularly with Artifact Registry.
Integrating with Google Cloud services
Skopeo’s lightweight design makes it easy to use across various Google Cloud services where container image operations are needed. Here’s how it fits into common Google Cloud environments:
-
Cloud Shell: Provides an ideal interactive environment for running Skopeo commands manually, benefiting from pre-configured authentication.
-
Compute Engine / GKE nodes: You can install Skopeo directly onto Compute Engine VMs or within container images running on GKE nodes. This allows for scripting image management tasks, with authentication typically handled via service accounts attached to the VM or node pool, or through securely mounted secrets.
-
Cloud Workstations: Include Skopeo in your developer toolchain by adding it to a shared custom Cloud Workstation image.
-
Cloud Build: You can use Skopeo directly in a build step (either by installing it or using a container image that includes it) to copy, inspect, or manipulate images, relying on the build service account for authentication with Artifact Registry.
-
Cloud Run / GKE runtime: While Skopeo itself isn’t typically part of the runtime services, it plays a crucial role upstream by managing the container images stored in Artifact Registry that these services pull and execute. Ensuring the correct, vetted images are available in the registry is where Skopeo’s management capabilities support reliable deployments.
Supporting security workflows
Skopeo can also play a role in reinforcing your security posture for container images. Its inspect command is useful for fetching image digests or other metadata, which can then be fed into vulnerability scanning tools or used by policy checkers as part of your CI/CD pipeline, ensuring that only compliant images proceed.
While Google Cloud’s Binary Authorization primarily verifies attestations about images (often created using gcloud or Cloud KMS), Skopeo does have capabilities related to image signing (skopeo copy --sign-by ...). This means Skopeo can be used to transport images that might already contain signatures according to formats like Sigstore’s Cosign, or to inspect signature information if it’s embedded within the image manifest.
However, its main contribution to security workflows in a GCP context is typically providing the necessary image metadata and facilitating the movement of images that are then verified by other dedicated security services like Binary Authorization.
Conclusion
Skopeo is an invaluable addition to any container developer’s toolkit, especially within the Google Cloud ecosystem. Its daemonless nature, combined with powerful commands for inspecting, copying, deleting, and exporting images, makes it excellent for interacting with Artifact Registry. It shines in automating CI/CD tasks within Cloud Build, simplifying image migrations, and enabling efficient image management without the overhead of a Docker daemon.
By integrating Skopeo into your workflows, you can achieve more efficient, streamlined, and scriptable container management on Google Cloud. Give it a try!
for the details.