Today, we are excited to announce fully managed tiered storage for Spanner, a new capability that lets you use larger datasets with Spanner by striking the right balance between cost and performance, while minimizing operational overhead through a simple, easy-to-use, interface.
Spanner powers mission-critical operational applications at organizations in financial services, retail, gaming, and many other industries. These workloads rely on Spanner’s elastic scalability and global consistency to deliveralways-on experiences at any size. For example, a global trade ledger at a bank or a multi-channel order and inventory management system at a retailer depend on Spanner to provide a consistent view of real-time data to make trades and assess risk, fulfill orders, or dynamically optimize prices.
But over time, settled trade records or fulfilled orders become less important to running the business, and instead drive historical reporting or legal compliance. These datasets don’t require the same real-time performance as “hot,” active, transactional data, prompting customers to look for ways to move this “cold” data to lower-cost storage.
However, moving to alternative types of storage typically requires complicated data pipelines and can impact the performance of the operational system. Manually separating data across storage solutions can result in inconsistent reads that require application-level reconciliation. Furthermore, the separation imposes significant limits on how applications can query across current and historical data for things like responding to regulators; it also increases governance touchpoints that need to be audited.
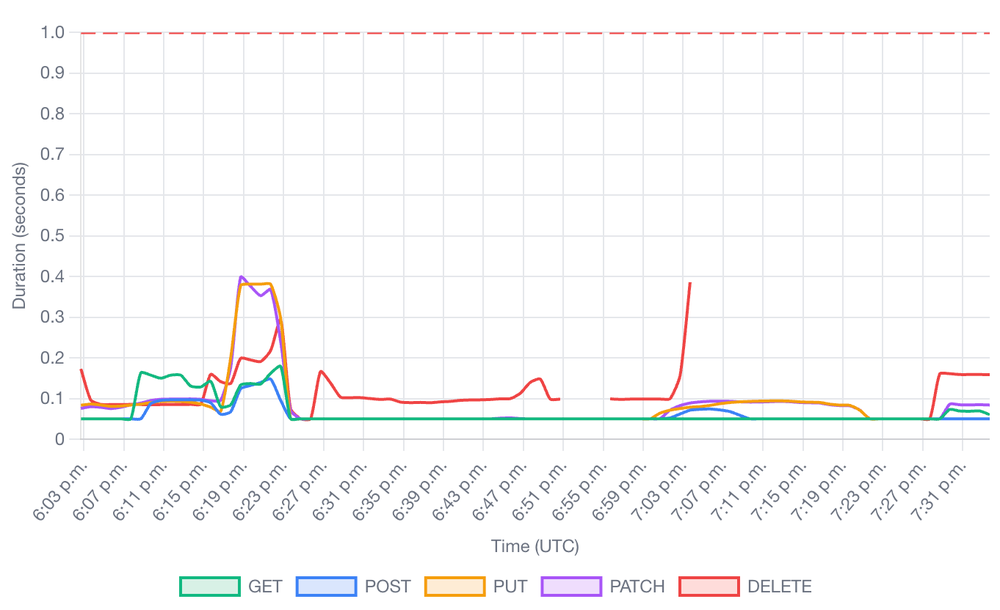
Tiered storage with Spanner addresses these challenges with a new storage tier based on hard disk drives (HDD) that is 80% cheaper than the existing tier based on solid-state drives (SSD), which is optimized for low-latency and high-throughput queries.
Beyondthe cost savings, benefits include:
Ease of management: Storage tiering with Spanner is entirely policy-driven, minimizing the toil and complexity of building and managing additional pipelines, or splitting/duplicating data across solutions. Asynchronous background processesautomatically move the data from SSD to HDD as part of background maintenance tasks.
Unified and consistent experience: In Spanner, the location of data storage is transparent to you.Queries on Spanner can access data across both SSD and HDD tiers without modification. Similarly, backup policies are applied consistentlyacross the data, enabling consistent restores across data in both the storage tiers.
Flexibility and control: Tiering policies can be applied to the database, table, column, or a secondary index, allowing you to choose what data to move to HDD. For example, data in a column that is rarely queried, e.g., JSON blobs for a long tail of product attributes, can easily be moved to HDD without having to split database tables. You can also choose to have some indexes on SSD, while the data resides in HDD.
“At Mercari, we use Spanner as the database for Merpay, our mobile payments platform that supports over 18.7 million users. With our ever-growing transaction volume, we were exploring options to store accumulated historic transaction data, but did not want to take on the overhead of constantly migrating data to another solution. The launch of Spanner tiered storage will allow us to store old data more cost-effectively, without requiring the use of another solution, while giving us the flexibility of querying it as needed.” – Shingo Ishimura, GAE Meister, Mercari
aside_block
<ListValue: [StructValue([(‘title’, ‘$300 in free credit to try Google Cloud databases’), (‘body’, <wagtail.rich_text.RichText object at 0x3e6c82979280>), (‘btn_text’, ‘Start building for free’), (‘href’, ‘http://console.cloud.google.com/freetrial?redirectPath=/products?#databases’), (‘image’, None)])]>
Let’s take a closer look
To get started, use GoogleSQL/PostgreSQL data definition language (DDL) to configure a locality group that defines storage options [‘SSD’ (default)/ HDD]. Locality groupsare a mechanism to provide data locality and isolation along a dimension (e.g., table, column) to optimize performance. While configuring a locality group, you can also use ‘ssd_to_hdd_spill_timespan’ to specify the time for which data should be stored on SSD before it moves off to HDD as part of a subsequent compaction cycle.
code_block
<ListValue: [StructValue([(‘code’, “# An HDD-only locality group.rnCREATE LOCALITY GROUP hdd_only OPTIONS (storage = ‘hdd’);rnrnrn# An SSD-only locality group.rnCREATE LOCALITY GROUP ssd_only OPTIONS (storage = ‘ssd’);rnrnrn# An HDD to SSD spill policy.rnCREATE LOCALITY GROUP recent_on_ssd OPTIONS (storage = ‘ssd’, ssd_to_hdd_spill_timespan = ’15d’);rnrnrn# Update the tiering policy on the entire database.rnALTER LOCALITY GROUP `default` SET OPTIONS (storage = ‘ssd’, ssd_to_hdd_spill_timespan = ’30d’);rnrnrn# Apply a locality group policy to a new table.rnCREATE TABLE PaymentLedger (rn TxnId INT64 NOT NULL,rn Amount INT64 NOT NULL,rn Account INT64 NOT NULL,rn Description STRING(MAX)rn) PRIMARY KEY (TxnId), OPTIONS (locality_group = ‘recent_on_ssd’);rnrnrn# Apply a locality group policy to an existing column.rnALTER TABLE PaymentLedger ALTER COLUMN Description SET OPTIONS (locality_group = ‘hdd_only’);”), (‘language’, ”), (‘caption’, <wagtail.rich_text.RichText object at 0x3e6c82979ee0>)])]>
Once the DDL has been configured, movement of data from SSD to HDD takes place asynchronously during weekly compaction cycles at the underlying storage layer without any user involvement.
HDD usage can be monitored from System Insights, which displays the amount of HDD storage used per locality group and the disk load at the instance level.
Spanner tiered storage supports both GoogleSQL and PostgreSQL-dialect databases and is available in all regions in which Spanner is available. This functionality is available with Enterprise/Enterprise Plus editions of Spanner for no additional cost beyond the cost of the HDD storage.
Get started with Spanner today
With tiered storage, customers can onboard larger datasets on Spanner by optimizing costs, while minimizing operational overhead through a unified customer experience. Visit our documentation to learn more.
Want tolearn moreabout what makes Spanner unique and how to use tiered storage?Try it yourself for freefor 90 days or for as little as $88 USD/month (Enterprise edition) for a production-ready instance that grows with your business without downtime or disruptive re-architecture.
This blog post presents an in-depth exploration of Microsoft’s Time Travel Debugging (TTD) framework, a powerful record-and-replay debugging framework for Windows user-mode applications. TTD relies heavily on accurate CPU instruction emulation to faithfully replay program executions. However, subtle inaccuracies within this emulation process can lead to significant security and reliability issues, potentially masking vulnerabilities or misleading critical investigations—particularly incident response and malware analysis—potentially causing analysts to overlook threats or draw incorrect conclusions. Furthermore, attackers can exploit these inaccuracies to intentionally evade detection or disrupt forensic analyses, severely compromising investigative outcomes.
The blog post examines specific challenges, provides historical context, and analyzes real-world emulation bugs, highlighting the critical importance of accuracy and ongoing improvement to ensure the effectiveness and reliability of investigative tooling. Ultimately, addressing these emulation issues directly benefits users by enhancing security analyses, improving reliability, and ensuring greater confidence in their debugging and investigative processes.
Overview
We begin with an introduction to TTD, detailing its use of a sophisticated CPU emulation layer powered by the Nirvana runtime engine. Nirvana translates guest instructions into host-level micro-operations, enabling detailed capture and precise replay of a program’s execution history.
The discussion transitions into exploring historical challenges in CPU emulation, particularly for the complex x86 architecture. Key challenges include issues with floating-point and SIMD operations, memory model intricacies, peripheral and device emulation, handling of self-modifying code, and the constant trade-offs between performance and accuracy. These foundational insights lay the groundwork for our deeper examination of specific instruction emulation bugs discovered within TTD.
These include:
A bug involving the emulation of thepop r16, resulting in critical discrepancies between native execution and TTD instrumentation.
An issue with thepush segmentinstruction that demonstrates differences between Intel and AMD CPU implementations, highlighting the importance of accurate emulation aligned with hardware behavior
Errors in the implementation of thelodsbandlodswinstructions, where TTD incorrectly clears upper bits that should remain unchanged.
An issue within the WinDbg TTDAnalyze debugging extension, where a fixed output buffer resulted in truncated data during symbol queries, compromising debugging accuracy.
Each case is supported by detailed analyses, assembly code proof-of-concept samples, and debugging traces, clearly illustrating the subtle but significant pitfalls in modern CPU emulation as it pertains to TTD.
Additional bugs discovered beyond those detailed here are pending disclosure until addressed by Microsoft. All bugs discussed in this post have been resolved as of TTD version 1.11.410.
Intro to TTD
Time Travel Debugging (TTD) is a powerful usermode record-and-replay framework developed by Microsoft, originally introduced in a 2006 whitepaper under a different name. It is a staple for our workflows as it pertains to Windows environments.
TTD allows a user to capture a comprehensive recording of a process (and potential child processes) during the lifetime of the process’s execution. This is done by injecting a dynamic-link library (DLL) into the intended target process and capturing each state of the execution. This comprehensive historical view of the program’s runtime behavior is stored in a database-like trace file (.trace), which, much like a database, can be further indexed to produce a corresponding .idx file for efficient querying and analysis.
Once recorded, trace files can be consumed by a compatible client that supports replaying the entire execution history. In other words, TTD effectively functions as a record/replay debugger, enabling analysts to move backward and forward through execution states as if navigating a temporal snapshot of the program’s lifecycle.
TTD relies on a CPU emulation layer to accurately record and replay program executions. This layer is implemented by the Nirvana runtime engine, which simulates guest instructions by translating them into a sequence of simpler, host-level micro-operations. By doing so, Nirvana provides fine-grained control at the instruction and sub-instruction level, allowing instrumentation to be inserted at each stage of instruction processing (e.g., fetching, memory reads, writes). This approach not only ensures that TTD can capture the complete dynamic behavior of the original binary but also makes it possible to accurately re-simulate executions later.
Nirvana’s dynamic binary translation and code caching techniques improve performance by reusing translated sequences when possible. In cases where code behaves unpredictably—such as self-modifying code scenarios—Nirvana can switch to a pure interpretation mode or re-translate instructions as needed. These adaptive strategies ensure that TTD maintains fidelity and efficiency during the record and replay process, enabling it to store execution traces that can be fully re-simulated to reveal intricate details of the code’s behavior under analysis.
The TTD framework is composed of several core components:
TTD: The main TTD client executable that takes as input a wide array of input arguments that dictate how the trace will be conducted.
TTDRecord: The main DLL responsible for the recording that runs within the TTD client executable. It initiates the injection sequence into the target binary by injecting TTDLoader.dll.
TTDLoader: DLL that gets injected into the guest process and initiates the recorder within the guest through the TTDRecordCPU DLL. It also establishes a process instrumentation callback within the guest process that allows Nirvana to monitor the egress of any system calls the guest makes.
TTDRecordCPU: The recorder responsible for capturing the execution states into the .trace file. This is injected as a DLL into the guest process and communicates the status of the trace with TTDRecord. The core logic works by emulating the respective CPU.
TTDReplay and TTDReplayClient: The replay components that read the captured state from the trace file and allow users to step through the recorded execution.
Windbg uses these to provide support for replacing trace files.
TTDAnalyze:A WinDbg extension that integrates with the replay client, providing exclusive TTD capacities to WinDbg. Most notable of these are the Calls and Memory data model methods.
CPU Emulation
Historically, CPU emulation—particularly for architectures as intricate as x86—has been a persistent source of engineering challenges. Early attempts struggled with instruction coverage and correctness, as documentation gaps and hardware errata made it difficult to replicate every nuanced corner case. Over time, a number of recurring problem areas and bug classes emerged:
Floating-Point and SIMD Operations: Floating-point instructions, with their varying precision modes and extensive register states, have often been a source of subtle bugs. Miscalculating floating-point rounding, mishandling denormalized numbers, or incorrectly implementing special instructions like FSIN or FCOS can lead to silent data corruption or outright crashes. Similarly, SSE, AVX, and other vectorized instructions introduce complex states that must be tracked accurately.
Memory Model and Addressing Issues: The x86 architecture’s memory model, which includes segmentation, paging, alignment constraints, and potential misalignments in legacy code, can introduce complex bugs. Incorrectly emulating memory accesses, not enforcing proper page boundaries, or failing to handle “lazy” page faults and cache coherency can result in subtle errors that only appear under very specific conditions.
Peripheral and Device Emulation: Emulating the behavior of x86-specific peripherals—such as serial I/O ports, PCI devices, PS/2 keyboards, and legacy controllers—can be particularly troublesome. These components often rely on undocumented behavior or timing quirks. Misinterpreting device-specific registers or neglecting to reproduce timing-sensitive interactions can lead to erratic emulator behavior or device malfunctions.
Compatibility with Older or Unusual Processors: Emulating older generations of x86 processors, each with their own peculiarities and less standardized features, poses its own set of difficulties. Differences in default mode settings, instruction variants, and protected-mode versus real-mode semantics can cause unexpected breakages. A once-working emulator may fail after it encounters code written for a slightly different microarchitecture or an instruction that was deprecated or implemented differently in an older CPU.
Self-Modifying Code and Dynamic Translation: Code that modifies itself at runtime demands adaptive strategies, such as invalidating cached translations or re-checking original code bytes on the fly. Handling these scenarios incorrectly can lead to stale translations, misapplied optimizations, and difficult-to-trace logic errors.
Performance vs. Accuracy Trade-Offs: Historically, implementing CPU emulators often meant juggling accuracy with performance. Naïve instruction-by-instruction interpretation provided correctness but was slow. Introducing caching or just-in-time (JIT)-based optimizations risked subtle synchronization issues and bugs if not properly synchronized with memory updates or if instruction boundaries were not well preserved.
Collectively, these historical challenges underscore that CPU emulation is not just about instruction decoding. It requires faithfully recreating intricate details of processor states, memory hierarchies, peripheral interactions, and timing characteristics. Even as documentation and tooling have improved, achieving both correctness and efficiency remains a delicate balancing act, and emulation projects continue to evolve to address these enduring complexities.
The Initial TTD Bug
Executing a heavily obfuscated 32-bit Windows Portable Executable (PE) file under TTD instrumentation resulted in a crash. The same sample file did not cause a crash while executing in a real computer or in a virtual machine. We suspected either the sample is detecting TTD execution and or TTD itself has a bug in emulating an instruction. A good thing about debugging TTD issues is that the TTD trace file itself can be used to pinpoint the cause of the issue most of the time. Figure 1 points to the crash while in TTD emulation.
Figure 1: Crash while accessing an address pointed by register ESI
Back tracing the ESIregister value to 0xfb3e took stepping back hundreds of instructions and ended up in the following sequence of instructions, as shown in Figure 2.
Figure 2: Register ESI getting populated by pop si and xchg si,bp
There are two instructions populating the ESI register, both working with the 16-bit sub register of SI while completely ignoring the other 16-bit part of the ESI register. If we look closely at the results after pop si instruction in Figure 2, the upper 16-bit of the ESI register seems to be nulled out. This looked like a bug in emulating pop r16 instructions, and we quickly wrote a proof-of-concept code for verification (Figure 3).
Figure 3: Proof-of-concept for pop r16
Running the resulting binary natively and with TTD instrumentation as shown in Figure 4 confirmed our suspicion that the pop r16 instructions are emulated differently in TTD than on a real CPU.
Figure 4: Running the code natively and with TTD instrumentation
We reported this issue and the fuzzing results to the TTD team at Microsoft.
Fuzzing TTD
Given there is one instruction emulation bug (instruction sequence that produces different results in real vs TTD execution), we decided to fuzz TTD to find similar bugs. A rudimentary harness was created to execute a random sequence of instructions and record the resulting values. This harness was executed on a real CPU and under TTD instrumentation, providing us with two sets of results. Any changes in results or partial lack of results points us to a likely instruction emulation bug.
This new bug was fairly similar to the original pop r16 bug, but with a push segment instruction. This bug also comes with a little bit of twist. While our fuzzer was running on an Intel CPU-based machine and one of us verified the bug locally, the other person was not able to verify the bug. Interestingly, the failure happened on an AMD-based CPU, tipping us to the possibility that the push segment instruction implementation varies between INTEL and AMD CPUs.
Looking at both INTEL and AMD CPU specifications, INTEL specification goes into details about how recent processors implement push segment register instruction:
If the source operand is a segment register (16 bits) and the operand size is 64-bits, a zero-extended value is pushed on the stack; if the operand size is 32-bits, either a zero-extended value is pushed on the stack or the segment selector is written on the stack using a 16-bit move. For the last case, all recent Intel Core and Intel Atom processors perform a 16-bit move, leaving the upper portion of the stack location unmodified. (INTEL spec Vol.2B 4-517)
We reported the discrepancy to AMD PSIRT, who concluded that this is not a security vulnerability. It seems sometime circa 2007 INTEL and AMD CPU started implementing the push segment instruction differently, and TTD emulation followed the old way.
The lodsband lodsware not correctly implemented for both 32-bit and 64-bit instructions. Both clear the upper bits of the register (rax/eax) whereas the original instructions only modify their respective granularities (i.e., lodsbwill only overwrite 1-byte, lodswonly 2-bytes).
Figure 6: Proof-of-concept for lodsb/lodsw
There are additional instruction emulation bugs pending fixes from Microsoft.
As we were pursuing our efforts in the CPU emulator, we accidentally stumbled on another bug, this time not in the emulator but inside the Windbg extension exposed by TTD: TTDAnalyze.dll.
This extension leverages the debugger’s data model to allow a user to interact with the trace file in an interactive manner. This is done via exposing a TTD data model namespace under certain parts of the data model, such as the current process (@$curproces), the current thread (@$curthread), and current debugging session (@$cursession).
Figure 7: TTD query types
As an example, the @$cursession.TTD.Callsmethod allows a user to query all call locations captured within the trace. It takes as input either an address or case-insensitive symbol name with support for regex. The symbol name can either be in the format of a string (with quotes) or parsed symbol name (without quotes). The former is only applicable when the symbols are resolved fully (e.g., private symbols), as the data model has support for converting private symbols into an ObjectTargetObjectobject thus making it consumable to the dxevaluation expression parser.
The bug in question directly affects the exposed Callsmethod under @$cursession.TTD.Callsbecause it uses a fixed, static buffer to capture the results of the symbol query. In Figure 8 we illustrate that by passing in two similar regex strings that produce inconsistent results.
Figure 8: TTD Calls query
When we query C*and Create*,the C*query results do not return the other Create APIs that were clearly captured in the trace. Under the hood, TTDAnalyzeexecutes the examine debugger command “x KERNELBASE!C*“ with a custom output capture to process the results. This output capture truncates any captured data if it is greater than 64 KB in size.
If we take the disassembly of the global buffer and output capture routine in TTDAnalyze(SHA256 CC5655E29AFA87598E0733A1A65D1318C4D7D87C94B7EBDE89A372779FF60BAD) prior to the fix, we can see the following (Figure 9 and Figure 10):
Figure 9: TTD implementation disassembly
Figure 10: TTD implementation disassembly
The capture for the examine command is capped at 64 KB. When the returned data exceeds this limit, truncation is performed at address 0x180029960. Naturally querying symbols starting with C* typically yields a large volume of results, not just those beginning with Create*, leading to the observed truncation of the data.
Final Thoughts
The analysis presented in this blog post highlights the critical nature of accuracy in instruction emulation—not just for debugging purposes, but also for ensuring robust security analysis. The observed discrepancies, while subtle, underscore a broader security concern: even minor deviations in emulation behavior can misrepresent the true execution of code, potentially masking vulnerabilities or misleading forensic investigations.
From a security perspective, the work emphasizes several key takeaways:
Reliability of Debugging Tools: TTD and similar frameworks are invaluable for reverse engineering and incident response. However, any inaccuracies in emulation, such as those revealed by the misinterpretation of pop r16, push segment, or lods* instructions, can compromise the fidelity of the analysis. This raises important questions about trust in our debugging tools when they are used to analyze potentially malicious or critical code.
Impact on Threat Analysis: The ability to replay a process’s execution with high fidelity is crucial for uncovering hidden behaviors in malware or understanding complex exploits. Instruction emulation bugs may inadvertently alter the execution path or state, leading to incomplete or skewed insights that could affect the outcome of a security investigation.
Collaboration and Continuous Improvement: The discovery of these bugs, followed by their detailed documentation and reporting to the relevant teams at Microsoft and AMD, highlights the importance of a collaborative approach to security research. Continuous testing, fuzzing, and cross-platform comparisons are essential in maintaining the integrity and security of our analysis tools.
In conclusion, this exploration not only sheds light on the nuanced challenges of CPU emulation within TTD, but also serves as a call to action for enhanced scrutiny and rigorous validation of debugging frameworks. By ensuring that these tools accurately mirror native execution, we bolster our security posture and improve our capacity to detect, analyze, and respond to sophisticated threats in an ever-evolving digital landscape.
Acknowledgments
We extend our gratitude to the Microsoft Time Travel Debugging team for their readiness and support in addressing the issues we reported. Their prompt and clear communication not only resolved the bugs but also underscored their commitment to keeping TTD robust and reliable. We further appreciate that they have made TTD publicly available—a resource invaluable for both troubleshooting and advancing Windows security research.
AI Hypercomputer is a fully integrated supercomputing architecture for AI workloads – and it’s easier to use than you think. In this blog, we break down four common use cases, including reference architectures and tutorials, representing just a few of the many ways you can use AI Hypercomputer today.
Short on time? Here’s a quick summary.
Affordable inference. JAX, Google Kubernetes Engine (GKE) and NVIDIA Triton Inference Server are a winning combination, especially when you pair them with Spot VMs for up to 90% cost savings. We have several tutorials, like this one on how to serve LLMs like Llama 3.1 405B on GKE.
Large and ultra-low latency training clusters. Hypercompute Cluster gives you physically co-located accelerators, targeted workload placement, advanced maintenance controls to minimize workload disruption, and topology-aware scheduling. You can get started by creating a cluster with GKE or try this pretraining NVIDIA GPU recipe.
High-reliability inference. Pair new cloud load balancing capabilities like custom metrics and service extensions with GKE Autopilot, which includes features like node auto-repair to automatically replace unhealthy nodes, and horizontal pod autoscaling to adjust resources based on application demand.
Easy cluster setup. The open-source Cluster Toolkit offers pre-built blueprints and modules for rapid, repeatable cluster deployments. You can get started with one of our AI/ML blueprints.
If you want to see a broader set of reference implementations, benchmarks and recipes, go to the AI Hypercomputer GitHub.
Why it matters Deploying and managing AI applications is tough. You need to choose the right infrastructure, control costs, and reduce delivery bottlenecks. AI Hypercomputer helps you deploy AI applications quickly, easily, and with more efficiency relative to just buying the raw hardware and chips.
Take Moloco, for example. Using the AI Hypercomputer architecture they achieved 10x faster model training times and reduced costs by 2-4x.
aside_block
<ListValue: [StructValue([(‘title’, ‘$300 in free credit to try AI Hypercomputer’), (‘body’, <wagtail.rich_text.RichText object at 0x3e47aa093880>), (‘btn_text’, ‘Start building for free’), (‘href’, ‘http://console.cloud.google.com/freetrial?redirectPath=/compute’), (‘image’, None)])]>
Let’s dive deeper into each use case.
1. Reliable AI inference
According to Futurum, in 2023 Google had ~3x fewer outage hours vs. Azure, and ~3x fewer than AWS. Those numbers fluctuate over time, but maintaining high availability is a challenge for everyone. The AI Hypercomputer architecture offers fully integrated capabilities for high-reliability inference.
Many customers start with GKE Autopilot because of its 99.95% pod-level uptime SLA. Autopilot enhances reliability by automatically managing nodes (provisioning, scaling, upgrades, repairs) and applying security best practices, freeing you from manual infrastructure tasks. This automation, combined with resource optimization and integrated monitoring, minimizes downtime and helps your applications run smoothly and securely.
There are several configurations available, but in this reference architecture we use TPUs with the JetStream Engine to accelerate inference, plus JAX, GCS Fuse, and SSDs (like Hyperdisk ML) to speed up the loading of model weights. As you can see, there are two notable additions to the stack that get us to high reliability: Service Extensions and custom metrics.
Service extensions allow you to customize the behavior of Cloud Load Balancer by inserting your own code (written as plugins) into the data path, enabling advanced traffic management and manipulation.
Custom metrics, utilizing the Open Request Cost Aggregation (ORCA) protocol, allow applications to send workload-specific performance data (like model serving latency) to Cloud Load Balancer, which then uses this information to make intelligent routing and scaling decisions.
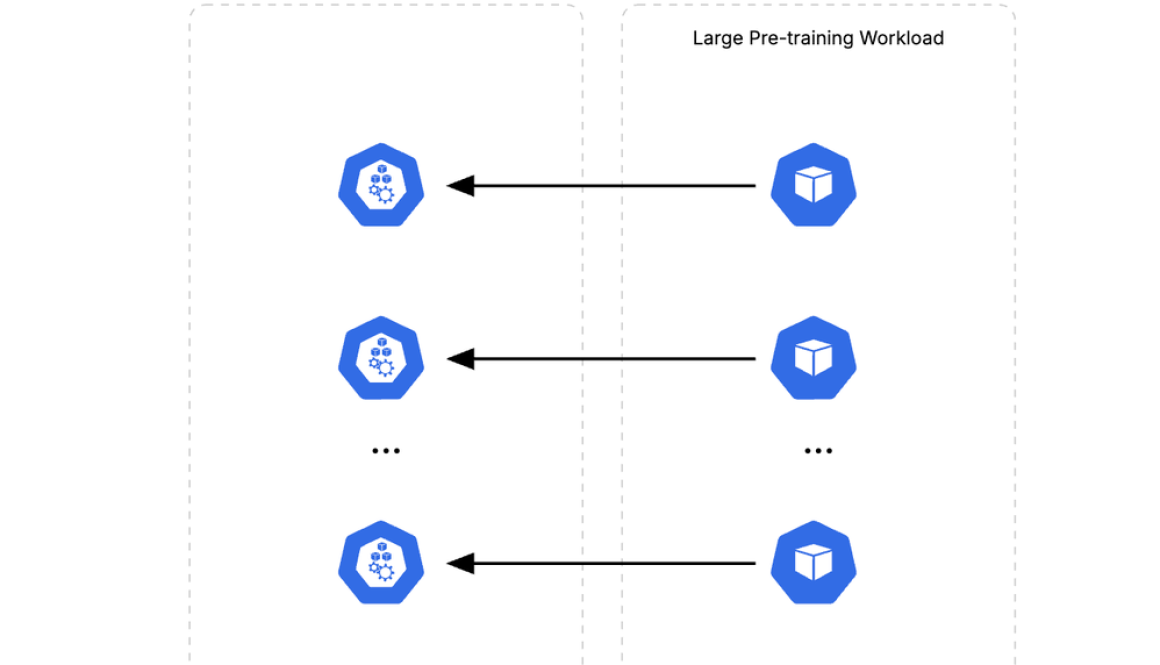
Training large AI models demands massive, efficiently scaled compute. Hypercompute Cluster is a supercomputing solution built on AI Hypercomputer that lets you deploy and manage a large number of accelerators as a single unit, using a single API call. Here are a few things that set Hypercompute Cluster apart:
Clusters are densely physically co-located for ultra-low-latency networking. They come with pre-configured and validated templates for reliable and repeatable deployments, and with cluster-level observability, health monitoring, and diagnostic tooling.
To simplify management, Hypercompute Clusters are designed for integrating with orchestrators like GKE and Slurm, and are deployed via the Cluster Toolkit. GKE provides support for over 50,000 TPU chips to train a single ML model.
In this reference architecture, we use GKE Autopilot and A3 Ultra VMs.
GKE supports up to 65,000 nodes — we believe this is more than 10X larger scale than the other two largest public cloud providers.
A3 Ultra usesNVIDIA H200 GPUswith twice the GPU-to-GPU network bandwidth and twice the high bandwidth memory (HBM) compared to A3 Mega GPUs. They are built with our new Titanium ML network adapter and incorporate NVIDIA ConnectX-7 network interface cards (NICs) to deliver a secure, high-performance cloud experience, perfect for large multi-node workloads on GPUs.
Serving AI, especially large language models (LLMs), can become prohibitively expensive. AI Hypercomputer combines open software, flexible consumption models and a wide range of specialized hardware to minimize costs.
Cost savings are everywhere, if you know where to look. Beyond the tutorials, there are two cost-efficient deployment models you should know. GKE Autopilot reduces the cost of running containers by up to 40% compared to standard GKE by automatically scaling resources based on actual needs, while Spot VMs can save up to 90% on batch or fault-tolerant jobs. You can combine the two to save even more — “Spot Pods” are available in GKE Autopilot to do just that.
In this reference architecture, after training with JAX, we convert into NVIDIA’s Faster Transformer format for inferencing. Optimized models are served via NVIDIA’s Triton on GKE Autopilot. Triton’s multi-model support allows for easy adaptation to evolving model architectures, and a pre-built NeMo container simplifies setup.
You need tools that simplify, not complicate, your infrastructure setup. The open-source Cluster Toolkit offers pre-built blueprints and modules for rapid, repeatable cluster deployments. You get easy integration with JAX, PyTorch, and Keras. Platform teams get simplified management with Slurm, GKE, and Google Batch, plus flexible consumption models like Dynamic Workload Scheduler and a wide range of hardware options. In this reference architecture, we set up an A3 Ultra cluster with Slurm:
Kubernetes, the container orchestration platform, is inherently a complex, distributed system. While it provides resilience and scalability, it can also introduce operational complexities, particularly when troubleshooting. Even with Kubernetes’ self-healing capabilities, identifying the root cause of an issue often requires deep dives into the logs of various independent components.
At Google Cloud, our engineers have been directly confronting this Kubernetes troubleshooting challenge for years as we support large-scale, complex deployments. In fact, the Google Cloud Support team has developed deep expertise in diagnosing issues within Kubernetes environments through routinely analyzing a vast number of customer support tickets, diving into user environments, and leveraging our collective knowledge to pinpoint the root causes of problems. To address this pervasive challenge, the team developed an internal tool: the Kubernetes History Inspector (KHI), and today, we’ve released it as open source for the community.
The Kubernetes troubleshooting challenge
In Kubernetes, each pod, deployment, service, node, and control-plane component generates its own stream of logs. Effective troubleshooting requires collecting, correlating, and analyzing these disparate log streams. But manually configuring logging for each of these components can be a significant burden, requiring careful attention to detail and a thorough understanding of the Kubernetes ecosystem. Fortunately, managed Kubernetes services such as Google Kubernetes Engine (GKE) simplify log collection. For example, GKE offers built-in integration with Cloud Logging, aggregating logs from all parts of the Kubernetes environment. This centralized repository is a crucial first step.
However, simply collecting the logs solves only half the problem. The real challenge lies in analyzing them effectively. Many issues you’ll encounter in a Kubernetes deployment are not revealed by a single, obvious error message. Instead, they manifest as a chain of events, requiring a deep understanding of the causal relationships between numerous log entries across multiple components.
Consider the scale: a moderately sized Kubernetes cluster can easily generate gigabytes of log data, comprising tens of thousands of individual entries, within a short timeframe. Manually sifting through this volume of data to identify the root cause of a performance degradation, intermittent failure, or configuration error is, at best, incredibly time-consuming, and at worst, practically impossible for human operators. The signal-to-noise ratio is incredibly challenging.
aside_block
<ListValue: [StructValue([(‘title’, ‘$300 in free credit to try Google Cloud containers and Kubernetes’), (‘body’, <wagtail.rich_text.RichText object at 0x3e47a7f95670>), (‘btn_text’, ‘Start building for free’), (‘href’, ‘http://console.cloud.google.com/freetrial?redirectpath=/marketplace/product/google/container.googleapis.com’), (‘image’, None)])]>
Introducing the Kubernetes History Inspector
KHI is a powerful tool that analyzes logs collected by Cloud Logging, extracts state information for each component, and visualizes it in a chronological timeline. Furthermore, KHI links this timeline back to the raw log data, allowing you to track how each element evolved over time.
The Google Cloud Support team often assists users in critical, time-sensitive situations. A tool that requires lengthy setup or agent installation would be impractical. That’s why we packaged KHI as a container image — it requires no prior setup, and is ready to be launched with a single command.
It’s easier to show than to tell. Imagine a scenario where end users are reporting “Connection Timed Out” errors on a service running on your GKE cluster. Launching KHI, you might see something like this:
First, notice the colorful, horizontal rectangles on the left. These represent the state changes of individual components over time, extracted from the logs – the timeline. This timeline provides a macroscopic view of your Kubernetes environment. In contrast, the right side of the interface displays microscopic details: raw logs, manifests, and their historical changes related to the component selected in the timeline. By providing both macroscopic and microscopic perspectives, KHI makes it easy to explore your logs.
Now, let’s go back to our hypothetical problem. Notice the alternating green and orange sections in the “Ready” row of the timeline:
This indicates that the readiness probe is fluctuating between failure (orange) and success (green). That’s a smoking gun! You now know exactly where to focus your troubleshooting efforts.
KHI also excels at visualizing the relationships between components at any given point in the past. The complex interdependencies within a Kubernetes cluster are presented in a clear, understandable way.
What’s next for KHI and Kubernetes troubleshooting
We’ve only scratched the surface of what KHI can do. There’s a lot more under the hood: how the timeline colors actually work, what those little diamond markers mean, and many other features that can speed up your troubleshooting. To make this available to everyone, we open-sourced KHI.
For detailed specifications, a full explanation of the visual elements, and instructions on how to deploy KHI on your own managed Kubernetes cluster, visit the KHI GitHub page. Currently KHI only works with GKE and Kubernetes on Google Cloud combined with Cloud Logging, but we plan to extend its capabilities to the vanilla open-source Kubernetes setup soon.
While KHI represents a significant leap forward in Kubernetes log analysis, it’s designed to amplify your existing expertise, not replace it. Effective troubleshooting still requires a solid understanding of Kubernetes concepts and your application’s architecture. KHI helps you, the engineer, navigate the complexity by providing a powerful map to view your logs to diagnose issues more quickly and efficiently.
KHI is just the first step in our ongoing commitment to simplifying Kubernetes operations. We’re excited to see how the community uses and extends KHI to build a more observable and manageable future for containerized applications. The journey to simplify Kubernetes troubleshooting is ongoing, and we invite you to join us.
Many businesses today use Software-as-a-Service (SaaS) applications, choosing them for their accessibility, scalability, and to reduce infrastructure overhead. These cloud-based tools provide immediate access to powerful functionality, allowing companies to streamline operations and focus on core business activities.
However, as companies grow and their data needs expand, they often find their SaaS data scattered across multiple applications. This is a significant hurdle, because when valuable information is siloed, it’s hard to generate a holistic view of business performance and make informed, data-driven decisions. Further, the SaaS provider landscape is fragmented — each has its own unique APIs, authentication methods, and data formats. This creates a complex integration challenge characterized by significant development effort, high maintenance costs, and potentially, security vulnerabilities.
Integrating data to establish a unified view
Salesforce Data Cloud (SFDC), a leading customer relationship management (CRM) solution, is a commonly used SaaS application that provides a comprehensive view of customer interactions, sales activities, and marketing campaigns, allowing businesses to identify trends and predict future behavior. But as enterprises accelerate their cloud modernization initiatives, organizations struggle to efficiently, reliably, and securely extract data from Salesforce.
Yet, achieving a truly unified view of that data is imperative. Consolidating SaaS data with operational data is not merely beneficial, but essential, providing the holistic perspective needed for decisive action, operational efficiency, and profound customer understanding. Consequently, the desire to leverage Salesforce data within Google Cloud for advanced analytics and generative AI is strong. However, realizing this potential is hindered by the significant complexity of the required integrations.
To help, we recently expanded Datastream, our fully managed change data capture (CDC) service, to support Salesforce as a source. Now in preview, this simplifies connecting to Salesforce, automatically capturing changes and delivering them to BigQuery, Cloud Storage, and other Google Cloud destinations. We currently support real-time data replication from operational databases such as Postgres, MySQL, SQL Server, and Oracle. By extending this support to Salesforce, customers can now easily merge their Salesforce data with other data sources to gain valuable insights.
aside_block
<ListValue: [StructValue([(‘title’, ‘$300 in free credit to try Google Cloud databases’), (‘body’, <wagtail.rich_text.RichText object at 0x3ea5c49accd0>), (‘btn_text’, ‘Start building for free’), (‘href’, ‘http://console.cloud.google.com/freetrial?redirectPath=/products?#databases’), (‘image’, None)])]>
Key benefits of Datastream
Support for Salesforce Data Cloud rounds out the Datastream offering, which provides a number of capabilities:
Better decisions and actionable intelligence: With Datastream’s low-latency replication, you can provide your business with up-to-the-minute insights from your Salesforce data.
Scalability and reliability: Datastream scales to handle large volumes of data, providing reliable replication.
Fully managed: No need to manage infrastructure or worry about maintenance, freeing your team to focus on core tasks.
Multiple authentication methods: Salesforce connectivity in Datastream supports both OAuth authentication and username and password authentication.
Support for backfill and CDC: Datastream supports both backfill and CDC (change data capture) from Salesforce source.
Get started with Salesforce source in Datastream
Integrating Datastream with Salesforce lets your business use Salesforce CRM to gain a comprehensive view of your data. By replicating data to Google Cloud for analysis, businesses can unlock deeper insights, improve accuracy, and streamline data pipelines. Learn more in the documentation.
Today, we’re announcing built-in performance monitoring and alerts for Gemini and other managed foundation models – right from Vertex AI’s homepage.
Monitoring the performance of generative AI models is crucial when building lightning-fast, reliable, and scalable applications. But understanding the performance of these models has historically had a steep learning curve: in the past, you had to learn where the metrics were stored and where you could find them in the Cloud Console.
Now, these metrics are available right on Vertex AI’s home page, where you can easily find and understand the health of your models. Cloud Monitoring shows a built-in dashboard providing information about usage, latency, and error rates on your gen AI models. You can also quickly configure an alert if any requests have failed or been delayed.
aside_block
<ListValue: [StructValue([(‘title’, ‘$300 in free credit to try Google Cloud AI and ML’), (‘body’, <wagtail.rich_text.RichText object at 0x3ea5c4899280>), (‘btn_text’, ‘Start building for free’), (‘href’, ‘http://console.cloud.google.com/freetrial?redirectPath=/vertex-ai/’), (‘image’, None)])]>
How it works
If you’re using Vertex AI foundation models, you can find overview metrics for your models on the Dashboard tab in Vertex AI, and click into an out-of-the-box dashboard in Cloud Monitoring to gain more information and customize the dashboard. Here, you will be better able to understand capacity constraints, predict costs, and troubleshoot errors. You can also quickly configure alerts to quickly inform you about failures and their causes.
View Model Observability in Vertex AI
Configure an alert
Let’s say you’re an SRE who is responsible for ensuring the uptime of your company’s new customer service chatbot. You want to find a dashboard that gives you a bird’s eye view of possible issues with the chatbot, whether they include slowness, errors, or unexpected usage volume. Instead of hunting for the right metrics and creating a dashboard that displays them, you can now go to the Vertex Dashboard page to view high level metrics, and click “Show all metrics” to view a detailed, opinionated dashboard with information about query rates, character and token throughput, latency, and errors.
Then, let’s say that you notice that your model returned a 429 error for a number of your requests. This happens when the ML serving region associated with your model runs out of aggregate capacity across customers. You can remediate the issue by purchasing provisioned throughput, switching ML processing locations, or scheduling non-urgent requests for a less busy time using batch requests. You can also quickly turn on a recommended alert that will let you know if more than 1% of your requests return 429 errors ever again.
Get started today
If you’re a user of managed gen AI models from Vertex AI Model Garden, check out the “Model Observability” tab in your project’s Vertex Dashboard page. Click “Show all metrics” to find the built-in dashboard. To configure recommended alerts related to your gen AI workloads, check out the Vertex AI Integration in Cloud Monitoring.
For many employees, the browser has become where they spend the majority of their working day. As more work is being done on the web, IT and security teams continue to invest in enterprise browsing experiences that offer more protections for corporate data, while making it easy for employees to get work done. Chrome Enterprise has given businesses the best of both worlds—allowing workers to use the browser they are most familiar with and giving IT and security leaders the advanced protections and controls to safeguard their business.
Whether it is the foundational policies and customizations available to all businesses through Chrome Enterprise Core, or the advanced data protections and secure access capabilities available in Chrome Enterprise Premium, businesses can count on Chrome to help keep employees productive and safe.
New improvements to Chrome Enterprise are continuing to level up how employees experience their enterprise browser with better transparency around the separation of work and personal browsing. This helps build more trust from employees, offering them better visibility into how data types are treated differently by their organization when using Chrome, especially when they are using their personal devices for work. IT and security teams can also benefit from enhanced profile reporting and data protections for unmanaged devices using Chrome profiles, ideal for bring your own device (BYOD) environments.
More transparency for corporate browsers
Many organizations are using the browser as a secure endpoint, enforcing secure access to critical apps and data for employees and contractors right at the browser layer. With the browser playing a more critical role in daily work, it’s more important than ever for IT teams to make it clear to employees that they are logged into a corporate browsing experience that is managed and monitored by their company. Chrome Enterprise makes this easier to signal than ever before by now allowing organizations to customize browser profiles with their company logo.
Companies can create a branded Chrome profile experience for their users while they work on the web. This clear visual identity helps employees understand that they are working in a secure enterprise profile, distinct from their personal browsing experience. Within the enterprise profile, additional settings and controls may be in place, and employees can get more information about what their companies are managing.
Employees will see more clearly that they are in a managed browser profile, and they can go a level deeper to understand more about their work browser. This allows IT and security teams to offer more visibility to their users about the protections in place.
In the upcoming releases of Chrome, even if IT teams do not customize the browser experience with their logo, if companies apply policies to their browser profile, employees will receive an indication that they are in a managed “Work” profile environment.
More streamlined sign in experience
For businesses using Google Workspace or Google Identity, employees will see a new sign in experience when they sign into their Chrome profile for work. This updated experience gives users more visibility into what’s being managed and shared with their organization as soon as they sign in, and it allows them to create a separate profile for work to keep their bookmarks, history, and more, distinct from their personal profile.
New Chrome Profile Reporting
While the experience for employees is improving for Chrome Profiles, we’ve recently also added more capabilities for IT teams. Now, enterprises can turn on reporting for signed-in managed users across platforms including Windows, Mac, Linux, and Android. In one streamlined view they can get critical information about browser versions, the operating system, policies, extensions and whether the device is corporate managed or personal. This is ideal for getting more visibility into BYOD or contractor scenarios.
Applying additional protections through managed profiles on unmanaged devices
Through Chrome profiles, enterprises can even enforce secure access and data protections on devices that are personally owned or unmanaged. Once signed into a work Chrome profile, organizations can use Chrome Enterprise Premium to apply critical data controls and make access decisions for business apps. For example, your company can require a contractor to log into a work Chrome profile to access a CRM tool, but copy and paste restrictions or screen shot blocking can be turned on for added protections. This offers an easy and secure way to ensure company policies are enforced on both managed and unmanaged devices, right through Chrome.
Getting started with Chrome Profiles
Organizations can customize Chrome to show their organization’s logo and name today using Chrome Enterprise Core, which is available to all businesses at no additional cost. They can also manage Chrome profiles, get reporting at the profile level and get security insights. If they want to apply more advanced data protections and enforce context aware access, they can try out Chrome Enterprise Premium.
We’re thrilled to launch our cloud region in Sweden. More than just another region, it represents a significant investment in Sweden’s future and Google’s ongoing commitment to empowering businesses and individuals with the power of the cloud. This new region, our 42nd globally and 13th in Europe, opens doors to opportunities for innovation, sustainability, and growth — within Sweden and across the globe. We’re excited about the potential it holds for your digital transformations and AI aspirations.
One of Sweden’s most globally recognized companies, IKEA, worked closely with Google Cloud on this new region:
“IKEA is delighted to collaborate with Google Cloud in celebrating the new region in Sweden, underscoring our shared commitment to fostering innovation in the country. Google Cloud’s scalable and reliable infrastructure helps us to deliver a seamless shopping experience for our customers, helping us make interior design more accessible to everyone.” – Francesco Marzoni, Chief Data & Analytics Officer, IKEA Retail (Ingka Group)
Swedish audio-streaming service Spotify is one of Google Cloud’s earliest customers, is also excited to welcome a Google Cloud region in its home country:
“Over the past decade, we’ve forged a valuable partnership with Google Cloud, growing and innovating together. In a space where speed is paramount and even milliseconds matter, the new Google Cloud region in Sweden will be a catalyst for accelerating innovation for Swedish businesses and digital unicorns. We’re excited to be part of this evolution and growing cloud community.” – Tyson Singer, VP of Technology & Platforms, Spotify
Fueling Swedish innovation and growth
This new region provides Swedish businesses, organizations, and individuals with a powerful new platform for growth, powered by Google Cloud technologies like AI, machine learning, and data analytics. By offering high-performance, low-latency cloud services in Sweden, we’re enabling faster application development, richer user experiences, and enhanced business agility for customers such as Tradera, an online marketplace:
“Google Cloud’s technology has empowered Tradera to enhance customers’ selling experience, enabling them to sell more and faster. The launch of Google Cloud’s new Swedish region will empower a wider range of businesses to reap the benefits we’ve experienced and innovate at the pace we have, and that’s exciting.” – Linus Sjöberg, CTO, Tradera
This region also directly addresses data residency requirements and digital sovereignty concerns, removing key barriers to cloud adoption for many Swedish organizations. For the first time, these organizations can harness the full potential of Google Cloud’s services while maintaining control over their data’s location. We see this as a pivotal moment, unlocking possibilities and empowering Swedish ingenuity to flourish. From startups disrupting traditional industries to established enterprises undergoing digital transformation, the new region in Sweden will provide the infrastructure and tools needed to thrive in the AI era.
aside_block
<ListValue: [StructValue([(‘title’, ‘Try Google Cloud for free’), (‘body’, <wagtail.rich_text.RichText object at 0x3ed9486d8340>), (‘btn_text’, ‘Get started for free’), (‘href’, ‘https://console.cloud.google.com/freetrial?redirectPath=/welcome’), (‘image’, None)])]>
In fact, the Swedish government’s AI Commission recently launched its AI roadmap proposing an AI factory for the public sector to collaborate on a common AI infrastructure. This new region highlights our partnership in the Swedish AI-innovation ecosystem by strengthening the country’s AI infrastructure capabilities:
“Swedish AI infrastructure investments, such as a Swedish cloud region, strengthens Swedish AI development and enables AI innovations with data stored in Sweden.” – Martin Svensson, Director of the Swedish National Center for Applied AI called AI Sweden
Google Cloud also offers organizations in Sweden a new way to build resiliently, reduce costs, and accelerate sustainability impact through the smarter use of data and AI. Current projections indicate this region will operate at or above 99% carbon-free energy (CFE) in its first full year of operation in 2026, due to the Swedish grid’s electricity mix. We estimate our Swedish operations will have one of the highest Google CFE1 scores among all electricity grid regions where Google operates. Google also announced its first Swedish power purchase agreement (PPA) in 2013, and has since signed additional long-term agreements with clean energy developers that enabled more than 700 megawatts (MW) of onshore wind projects in the country.
Technical advantages
Beyond its local impact, the region in Sweden offers a host of technical benefits. Digital bank Nordnet looks forward to taking advantage of them:
“By partnering with Google Cloud, Nordnet has built a new, cloud-native platform that takes advantage of faster time-to-market, improved scalability, and enhanced security. Google Cloud’s new Swedish region gives us the possibility to further strengthen these benefits, enabling Nordnet to enhance its platform for savings and investments, offer exceptional customer experience, and accelerate our growth.” – Elias Lindholm, CTO, Nordnet
The new region’s technical benefits include:
High performance and low latency: Experience just milliseconds of latency to Stockholm and significantly reduced latency for users across Sweden and neighboring countries. This translates to faster application response times, smoother streaming, and enhanced online experiences, boosting productivity and user satisfaction. One of our customers, Bonnier News, exemplifies this technological edge:
“In today’s fast-paced media landscape, timely news delivery and rapid adaptation are crucial. The new Google Cloud region in Sweden offers Bonnier News the agility and speed we need to innovate and stay ahead. With faster data processing and lower latency, we can ensure our readers get the latest news and insights, whenever and wherever they need it.” – Lina Hallmer, CTO, Bonnier News
Uncompromising data sovereignty and security: This new region in Sweden benefits from our robust infrastructure, including data encryption at rest and in transit, granular data access controls, data residency, and sophisticated threat detection systems. We adhere to the highest international security and data protection standards to help ensure the confidentiality, integrity, and sovereignty of your data.
Scalability and flexibility on demand: Google Cloud’s infrastructure is designed to scale easily with your business. Whether you’re a small startup or a large corporation, you can easily adjust your resources to meet your evolving needs.
Investing in Sweden’s digital future
Google’s commitment to Sweden extends beyond this new cloud region. We’re making significant investments in the country’s digital ecosystem to foster talent development and support local communities. Initiatives include:
Exclusive launch partnerships: We’re thrilled to announce the launch of our new cloud region in collaboration with our exclusive launch partners: Devoteam and Tietoevry Tech Services. The deep engineering and consulting expertise of our launch partners helps customers quickly realize the benefits of the new region.
Local collaboration: We’re working with Swedish businesses, educational institutions, and government organizations to create a thriving cloud ecosystem. These collaborations focus on skills development, knowledge sharing, and supporting local innovation.
Looking ahead: A partnership for progress
The launch of the new cloud region in Sweden is just the first step in our journey together. We’re dedicated to ongoing investment in Sweden, partnering with local businesses and organizations to build a thriving digital future. This region will be a powerful engine for innovation and growth, empowering Swedish organizations to transform their industries, unlock new opportunities, and shape the world of tomorrow. We can’t wait to see what you create, look for Stockholm (europe-north2) in the console to get started today! Välkommen till Google Cloud, Sweden!
1. Carbon-free energy is any type of electricity generation that doesn’t directly emit carbon dioxide, including (but not limited to) solar, wind, geothermal, hydropower, and nuclear. Sustainable biomass and carbon capture and storage (CCS) are special cases considered on a case-by-case basis, but are often also considered carbon-free energy sources. For more information on our carbon-free energy strategy and plans, see Google’s 2024 Environmental Report.
Is your legacy database sticking you with rising costs, frustrating downtime, and scalability challenges? For organizations that strive for top performance and agility, legacy database systems can become significant roadblocks to innovation.
But there’s good news. According to a new Forrester Total Economic Impact™ (TEI) study, organizations may realize significant benefits by deploying Spanner, Google Cloud’s always-on, globally consistent, multi-model database with virtually unlimited scale. What kind of benefits? We’re talking an ROI of 132% over three years, and multi-million-dollar benefits and cost savings for a representative composite organization.
Read on for more, then download the full study to see the results and learn how Spanner can help your organization increase cost savings and profit, as well as reliability and operational efficiencies.
The high cost of the status quo
Legacy, on-premises databases often come with a hefty price tag that goes far beyond initial hardware and software investments. According to the Forrester TEI study, these databases can be a burden to maintain, requiring dedicated IT staff and specialized expertise, as well as high capital expenditures and operational overhead. Outdated systems can also limit your ability to respond quickly to changing market demands and customer needs, such as demand spiking for a new game or a viral new product.
aside_block
<ListValue: [StructValue([(‘title’, ‘$300 in free credit to try Google Cloud databases’), (‘body’, <wagtail.rich_text.RichText object at 0x3e96e4dbffd0>), (‘btn_text’, ‘Start building for free’), (‘href’, ‘http://console.cloud.google.com/freetrial?redirectPath=/products?#databases’), (‘image’, None)])]>
To quantify the benefits that Spanner can bring to an organization, Forrester used its TEI methodology, conducting in-depth interviews with seven leading organizations across the globe who had adopted Spanner. These organizations came from a variety of industries such as retail, financial services, software and technology, gaming, and transportation. Based on its findings, Forrester created a representative composite organization: a business-to-consumer (B2C) organization with revenue of $1 billion per year, and modeled the potential financial impact of adopting Spanner.
In addition to a 132% return on investment (ROI) with a 9-month payback period, Forrester found that the composite organization also realized $7.74M in total benefits over the three years, from a variety of sources:
Cost savings from retiring on-prem legacy database: By retiring the on-prem legacy database and transitioning to Spanner, the composite organization can save $3.8 million over three years. Savings came from reduced infrastructure capital expenditure, maintenance costs, and system licensing expenses.
“The system before migration was more expensive. It was the cost of the entire system including the application, database, monitoring, and everything. We paid within the $5 million to $10 million range for a mainframe, and I expect that the cost of it would almost double within the next few years. Currently, we pay 90% less for Spanner.” – Senior Principal Architect at a software and technology organization
Profit retention and cost savings from reduced unplanned downtime: Prior to adopting Spanner, organizations suffered unplanned database downtime triggered by technical malfunctions, human errors, data integration issues, or natural disasters. With up to 99.999% availability, Spanner virtually eliminates unplanned downtime. Forrester calculates that the composite organization achieves $1.2 million in cost savings and profit retention due to reduced unplanned downtime.
“In the last seven years since we migrated to Spanner, the total number of failures caused by Spanner is zero. Prior to Spanner, some sort of problem would occur about once a month including a major problem once a year.” – Tech Lead, gaming organization
Cost savings from reduced overprovisioning for peak usage: With on-prem database systems, long infrastructure procurement cycles and large up-front expenditures mean that organizations typically provision for peak usage — even if that means they are over-provisioned most of the time. Spanner’s elastic scalability allows organizations to start small and scale up and down effortlessly as usage changes. Databases can scale up for however long you need, and then down again, cutting costs and the need to predict usage. For the composite organization, this results in cost savings of $1 million over three years.
“The number of transactions we are able to achieve is one of the main reasons that we use Spanner. Additionally, Spanner is highly consistent, and we save on the number of engineers needed for managing our databases.” – Head of SRE, DevOps, and Infrastructure, financial services organization
Efficiencies gained in onboarding new applications: Spanner accelerates development of new applications by eliminating the need to preplan resources. This resulted in 80% reduction in time to onboard new applications and $981,000 in cost savings for the composite organization.
Beyond the numbers
Beyond the quantifiable ROI, the Forrester TEI study highlights unquantified benefits that amplify Spanner’s value. These include:
Improved budget predictability, as Spanner shifts expenditures from capex to opex, enabling more effective resource allocation and forecasting.
Greater testing and deployment flexibility, allowing software development engineers to rapidly scale development environments for testing, conduct thorough load tests, and quickly shut down resources.
Expert Google Cloud customer service, providing helpful guidance to maximize Spanner’s benefits.
“The Spanner team are experts. They have a deep understanding of the product they’ve built with deep insights on how we’re using the product if we ask them.” – Head of Engineering, financial services organization
An innovation-friendly architecture, facilitating the design and implementation of new business capabilities and expansion, improving automation and customer satisfaction, all without incurring downtime.
Together, these strategic advantages contribute to organizational agility and long-term success.
Unlock the potential of your data with Spanner
We believe the Forrester TEI study clearly demonstrates that Spanner is more than just a database; it’s a catalyst for business transformation. By eliminating the constraints of legacy systems, Spanner empowers organizations to achieve significant cost savings, improve operational efficiencies, and unlock new levels of innovation. Are you ready to transform your data infrastructure and unlock your organization’s full potential?
It’s indisputable. Over just a few short years, AI and machine learning have redefined day-to-day operations across the federal government–from vital public agencies, to federally-funded research NGOs, to specialized departments within the military—delivering results and positively serving the public good. We stand at a pivotal moment in time, a New Era of American Innovation, where AI is reshaping every aspect of our lives.
At Google, we recognize the immense potential of this moment, and we’re deeply invested in ensuring that this innovation benefits all Americans. Our commitment goes beyond simply developing cutting-edge technology. We’re focused on building a stronger and safer America.
Let’s take a closer look at just a few examples of AI-powered innovations and the transformative impact they are having across agencies.
The National Archives and Records Administration (NARA) serves as the U.S. Government’s central recordkeeper—digitizing and cataloging billions of federal documents and other historical records–starting with the original Constitution and Declaration of Independence–at the National Archives. As the sheer volume of these materials inevitably grows over time, NARA’s mission includes leveraging new technologies to expand—yet simplify—public access, for novice info-seekers and seasoned researchers alike.
Sifting through NARA’s massive repositories traditionally required some degree of detective work—often weaving archival terminology into complex manual queries. As part of a 2023 initiative to improve core operations, NARA incorporated Google Cloud’s Vertex AI and Gemini into their searchable database, creating an advanced level of intuitive AI-powered semantic search. This allowed NARA to more accurately interpret a user’s context and intent behind queries, leading to faster and more relevant results.
The Aerospace Corporation is a federally funded nonprofit dedicated to exploring and solving challenges within humankind’s “space enterprise.” Their important work extends to monitoring space weather—solar flares, geomagnetic storms and other cosmic anomalies, which can affect orbiting satellites, as well as communications systems and power grids back on earth. The Aerospace Corporation partnered with Google Public Sector to revolutionize space weather forecasting using AI. This collaboration leverages Google Cloud’s AI and machine learning capabilities to improve the accuracy and timeliness of space weather predictions, and better safeguard critical infrastructure and national security from the impacts of space weather events.
The Air Force Research Laboratory (AFRL) leads the U.S. Air Force’s development and deployment of new strategic technologies to defend air, space and cyberspace. AFRL partnered with Google Cloud to integrate AI and machine learning into key areas of research, such as bioinformatics, web application efficiency, human performance, and streamlined AI-based data modeling. By leveraging Google App Engine, BigQuery, and Vertex AI, AFRL has accelerated and improved performance of its research and development platforms while aligning with broader Department of Defense initiatives to adopt and integrate leading-edge AI technologies.
Google’s AI innovations are truly powering the next wave of transformation and mission impact across the public sector—from transforming how we access our history, to understanding the cosmos, to strengthening national defense back on Earth, with even more promise on the horizon.
At Google Public Sector, we’re passionate about supporting your mission. Learn more about how Google’s AI solutions can empower your agency and hear more about how we are accelerating mission impact with AI by joining us at Google Cloud Next 25 in Las Vegas.
As AI use increases, security remains a top concern, and we often hear that organizations are worried about risks that can come with rapid adoption. Google Cloud is committed to helping our customers confidently build and deploy AI in a secure, compliant, and private manner.
Today, we’re introducing a new solution that can help you mitigate risk throughout the AI lifecycle. We are excited to announce AI Protection, a set of capabilities designed to safeguard AI workloads and data across clouds and models — irrespective of the platforms you choose to use.
AI Protection helps teams comprehensively manage AI risk by:
Discovering AI inventory in your environment and assessing it for potential vulnerabilities
Securing AI assets with controls, policies, and guardrails
Managing threats against AI systems with detection, investigation, and response capabilities
AI Protection is integrated with Security Command Center (SCC), our multicloud risk-management platform, so that security teams can get a centralized view of their AI posture and manage AI risks holistically in context with their other cloud risks.
AI Protection helps organizations discover AI inventory, secure AI assets, and manage AI threats, and is integrated with Security Command Center.
Discovering AI inventory
Effective AI risk management begins with a comprehensive understanding of where and how AI is used within your environment. Our capabilities help you automatically discover and catalog AI assets, including the use of models, applications, and data — and their relationships.
Understanding what data supports AI applications and how it’s currently protected is paramount. Sensitive Data Protection (SDP) now extends automated data discovery to Vertex AI datasets to help you understand data sensitivity and data types that make up training and tuning data. It can also generate data profiles that provide deeper insight into the type and sensitivity of your training data.
Once you know where sensitive data exists, AI Protection can use Security Command Center’s virtual red teaming to identify AI-related toxic combinations and potential paths that threat actors could take to compromise this critical data, and recommend steps to remediate vulnerabilities and make posture adjustments.
aside_block
<ListValue: [StructValue([(‘title’, ‘$300 in free credit to try Google Cloud security products’), (‘body’, <wagtail.rich_text.RichText object at 0x3e4f812c9eb0>), (‘btn_text’, ‘Start building for free’), (‘href’, ‘http://console.cloud.google.com/freetrial?redirectPath=/welcome’), (‘image’, None)])]>
Securing AI assets
Model Armor, a core capability of AI Protection, is now generally available. It guards against prompt injection, jailbreak, data loss, malicious URLs, and offensive content. Model Armor can support a broad range of models across multiple clouds, so customers get consistent protection for the models and platforms they want to use — even if that changes in the future.
Model Armor provides multi-model, multicloud support for generative AI applications.
Today, developers can easily integrate Model Armor’s prompt and response screening into applications using a REST API or through an integration with Apigee. The ability to deploy Model Armor in-line without making any app changes is coming soon through integrations with Vertex AI and our Cloud Networking products.
“We are using Model Armor not only because it provides robust protection against prompt injections, jailbreaks, and sensitive data leaks, but also because we’re getting a unified security posture from Security Command Center. We can quickly identify, prioritize, and respond to potential vulnerabilities — without impacting the experience of our development teams or the apps themselves. We view Model Armor as critical to safeguarding our AI applications and being able to centralize the monitoring of AI security threats alongside our other security findings within SCC is a game-changer,” said Jay DePaul, chief cybersecurity and technology risk officer, Dun & Bradstreet.
Organizations can use AI Protection to strengthen the security of Vertex AI applications by applying postures in Security Command Center. These posture controls, designed with first-party knowledge of the Vertex AI architecture, define secure resource configurations and help organizations prevent drift or unauthorized changes.
Managing AI threats
AI Protection operationalizes security intelligence and research from Google and Mandiant to help defend your AI systems. Detectors in Security Command Center can be used to uncover initial access attempts, privilege escalation, and persistence attempts for AI workloads. New detectors to AI Protection based on the latest frontline intelligence to help identify and manage runtime threats such as foundational model hijacking are coming soon.
“As AI-driven solutions become increasingly commonplace, securing AI systems is paramount and surpasses basic data protection. AI security — by its nature — necessitates a holistic strategy that includes model integrity, data provenance, compliance, and robust governance,” said Dr. Grace Trinidad, research director, IDC.
“Piecemeal solutions can leave and have left critical vulnerabilities exposed, rendering organizations susceptible to threats like adversarial attacks or data poisoning, and added to the overwhelm experienced by security teams. A comprehensive, lifecycle-focused approach allows organizations to effectively mitigate the multi-faceted risks surfaced by generative AI, as well as manage increasingly expanding security workloads. By taking a holistic approach to AI protection, Google Cloud simplifies and thus improves the experience of securing AI for customers,” she said.
Complement AI Protection with frontline expertise
The Mandiant AI Security Consulting Portfolio offers services to help organizations assess and implement robust security measures for AI systems across clouds and platforms. Consultants can evaluate the end-to-end security of AI implementations and recommend opportunities to harden AI systems. We also provide red teaming for AI, informed by the latest attacks on AI services seen in frontline engagements.
Building on a secure foundation
Customers can also benefit from using Google Cloud’s infrastructure for building and running AI workloads. Our secure-by-design, secure-by-default cloud platform is built with multiple layers of safeguards, encryption, and rigorous software supply chain controls.
For customers whose AI workloads are subject to regulation, we offer Assured Workloads to easily create controlled environments with strict policy guardrails that enforce controls such as data residency and customer-managed encryption. Audit Manager can produce evidence of regulatory and emerging AI standards compliance. Confidential Computing can help ensure data remains protected throughout the entire processing pipeline, reducing the risk of unauthorized access, even by privileged users or malicious actors within the system.
Additionally, for organizations looking to discover unsanctioned use of AI, or shadow AI, in their workforce, Chrome Enterprise Premium can provide visibility into end-user activity as well as prevent accidental and intentional exfiltration of sensitive data in gen AI applications.
Next steps
Google Cloud is committed to helping your organization protect its AI innovations. Read more in this showcase paper from Enterprise Strategy Group and attend our upcoming online Security Talks event on March 12.
To evaluate AI Protection in Security Command Center and explore subscription options, please contact a Google Cloud sales representative or authorized Google Cloud partner.
More exciting capabilities are coming soon and we will be sharing in-depth details on AI Protection and how Google Cloud can help you securely develop and deploy AI solutions at Google Cloud Next in Las Vegas, April 9 to 11.
In our day-to-day work, the FLARE team often encounters malware written in Go that is protected using garble. While recent advancements in Go analysis from tools like IDA Pro have simplified the analysis process, garble presents a set of unique challenges, including stripped binaries, function name mangling, and encrypted strings.
Garble’s string encryption, while relatively straightforward, significantly hinders static analysis. In this blog post, we’ll detail garble’s string transformations and the process of automatically deobfuscating them.
We’re also introducing GoStringUngarbler, a command-line tool written in Python that automatically decrypts strings found in garble-obfuscated Go binaries. This tool can streamline the reverse engineering process by producing a deobfuscated binary with all strings recovered and shown in plain text, thereby simplifying static analysis, malware detection, and classification.
Before detailing the GoStringUngarbler tool, we want to briefly explain how the garble compiler modifies the build process of Go binaries. By wrapping around the official Go compiler, garbleperforms transformations on the source code during compilation through Abstract Syntax Tree (AST) manipulation using Go’s go/ast library. Here, the obfuscating compiler modifies program elements to obfuscate the produced binary while preserving the semantic integrity of the program. Once transformed by garble, the program’s AST is fed back into the Go compilation pipeline, producing an executable that is harder to reverse engineer and analyze statically.
While garble can apply a variety of transformations to the source code, this blog post will focus on its “literal” transformations. When garble is executed with the -literalsflag, it transforms all literal strings in the source code and imported Go libraries into an obfuscated form. Each string is encoded and wrapped behind a decrypting function, thwarting static string analysis.
For each string, the obfuscating compiler can randomly apply one of the following literal transformations. We’ll explore each in greater detail in subsequent sections.
Stack transformation: This method implements runtime encoding to strings stored directly on the stack.
Seed transformation: This method employs a dynamic seed-based encryption mechanism where the seed value evolves with each encrypted byte, creating a chain of interdependent encryption operations.
Split transformation: This method fragments the encrypted strings into multiple chunks, each to be decrypted independently in a block of a main switch statement.
Stack Transformation
The stack transformation in garbleimplements runtime encrypting techniques that operate directly on the stack, using three distinct transformation types: simple, swap, and shuffle. These names are taken directly from the garble’s source code. All three perform cryptographic operations with the string residing on the stack, but each differs in complexity and approach to data manipulation.
Simple transformation: This transformation applies byte-by-byte encoding using a randomly generated mathematical operator and a randomly generated key of equal length to the input string.
Swap transformation: This transformation applies a combination of byte-pair swapping and position-dependent encoding, where pairs of bytes are shuffled and encrypted using dynamically generated local keys.
Shuffle transformation: This transformation applies multiple layers of encryption by encoding the data with random keys, interleaving the encrypted data with its keys, and applying a permutation with XOR-based index mapping to scatter the encrypted data and keys throughout the final output.
Simple Transformation
This transformation implements a straightforward byte-level encoding scheme at the AST level. The following is the implementation from the garble repository. In Figure 1 and subsequent code samples taken from the garble repository, comments were added by the author for readability.
// Generate a random key with the same length as the input string
key := make([]byte, len(data))
// Fill the key with random bytes
obfRand.Read(key)
// Select a random operator (XOR, ADD, SUB) to be used for encryption
op := randOperator(obfRand)
// Encrypt each byte of the data with the key using the random operator
for i, b := range key {
data[i] = evalOperator(op, data[i], b)
}
Figure 1: Simple transformation implementation
The obfuscator begins by generating a random key of equal length to the input string. It then randomly selects a reversible arithmetic operator (XOR, addition, or subtraction) that will be used throughout the encoding process.
The obfuscation is performed by iterating through the data and key bytes simultaneously, applying the chosen operator between each corresponding pair to produce the encoded output.
Figure 2 shows the decompiled code produced by IDA of a decrypting subroutine of this transformation type.
Figure 2: Decompiled code of a simple transformation decrypting subroutine
// Determines how many swap operations to perform based on data length
func generateSwapCount(obfRand *mathrand.Rand, dataLen int) int {
// Start with number of swaps equal to data length
swapCount := dataLen
// Calculate maximum additional swaps (half of data length)
maxExtraPositions := dataLen / 2
// Add a random amount if we can add extra positions
if maxExtraPositions > 1 {
swapCount += obfRand.Intn(maxExtraPositions)
}
// Ensure swap count is even by incrementing if odd
if swapCount%2 != 0 {
swapCount++
}
return swapCount
}
func (swap) obfuscate(obfRand *mathrand.Rand, data []byte)
*ast.BlockStmt {
// Generate number of swap operations to perform
swapCount := generateSwapCount(obfRand, len(data))
// Generate a random shift key
shiftKey := byte(obfRand.Uint32())
// Select a random reversible operator for encryption
op := randOperator(obfRand)
// Generate list of random positions for swapping bytes
positions := genRandIntSlice(obfRand, len(data), swapCount)
// Process pairs of positions in reverse order
for i := len(positions) - 2; i >= 0; i -= 2 {
// Generate a position-dependent local key for each pair
localKey := byte(i) + byte(positions[i]^positions[i+1]) + shiftKey
// Perform swap and encryption:
// - Swap positions[i] and positions[i+1]
// - Encrypt the byte at each position with the local key
data[positions[i]], data[positions[i+1]] = evalOperator(op,
data[positions[i+1]], localKey), evalOperator(op, data[positions[i]],
localKey)
}
...
Figure 3: Swap transformation implementation
The transformation begins by generating an even number of random swap positions, which is determined based on the data length plus a random number of additional positions (limited to half the data length). The compiler then randomly generates a list of random swap positions with this length.
The core obfuscation process operates by iterating through pairs of positions in reverse order, performing both a swap operation and encryption on each pair. For each iteration, it generates a position-dependent local encryption key by combining the iteration index, the XOR result of the current position pair, and a random shift key. This local key is then used to encrypt the swapped bytes with a randomly selected reversible operator.
Figure 4 shows the decompiled code produced by IDA of a decrypting subroutine of the swap transformation.
Figure 4: Decompiled code of a swap transformation decrypting subroutine
Shuffle Transformation
The shuffle transformation is the most complicated of the three stack transformation types. Here, garbleapplies its obfuscation by encrypting the original string with random keys, interleaving the encrypted data with its keys, and scattering the encrypted data and keys throughout the final output. Figure 5 shows the implementation from the garble repository.
// Generate a random key with the same length as the original string
key := make([]byte, len(data))
obfRand.Read(key)
// Constants for the index key size bounds
const (
minIdxKeySize = 2
maxIdxKeySize = 16
)
// Initialize index key size to minimum value
idxKeySize := minIdxKeySize
// Potentially increase index key size based on input data length
if tmp := obfRand.Intn(len(data)); tmp > idxKeySize {
idxKeySize = tmp
}
// Cap index key size at maximum value
if idxKeySize > maxIdxKeySize {
idxKeySize = maxIdxKeySize
}
// Generate a secondary key (index key) for index scrambling
idxKey := make([]byte, idxKeySize)
obfRand.Read(idxKey)
// Create a buffer that will hold both the encrypted data and the key
fullData := make([]byte, len(data)+len(key))
// Generate random operators for each position in the full data buffer
operators := make([]token.Token, len(fullData))
for i := range operators {
operators[i] = randOperator(obfRand)
}
// Encrypt data and store it with its corresponding key
// First half contains encrypted data, second half contains the key
for i, b := range key {
fullData[i], fullData[i+len(data)] = evalOperator(operators[i],
data[i], b), b
}
// Generate a random permutation of indices
shuffledIdxs := obfRand.Perm(len(fullData))
// Apply the permutation to scatter encrypted data and keys
shuffledFullData := make([]byte, len(fullData))
for i, b := range fullData {
shuffledFullData[shuffledIdxs[i]] = b
}
// Prepare AST expressions for decryption
args := []ast.Expr{ast.NewIdent("data")}
for i := range data {
// Select a random byte from the index key
keyIdx := obfRand.Intn(idxKeySize)
k := int(idxKey[keyIdx])
// Build AST expression for decryption:
// 1. Uses XOR with index key to find the real positions of data
and key
// 2. Applies reverse operator to decrypt the data using the
corresponding key
args = append(args, operatorToReversedBinaryExpr(
operators[i],
// Access encrypted data using XOR-ed index
ah.IndexExpr("fullData", &ast.BinaryExpr{X: ah.IntLit(shuffledIdxs[i]
^ k), Op: token.XOR, Y: ah.CallExprByName("int", ah.IndexExpr("idxKey",
ah.IntLit(keyIdx)))}),
// Access corresponding key using XOR-ed index
ah.IndexExpr("fullData", &ast.BinaryExpr{X:
ah.IntLit(shuffledIdxs[len(data)+i] ^ k), Op: token.XOR, Y:
ah.CallExprByName("int", ah.IndexExpr("idxKey", ah.IntLit(keyIdx)))}),
))
}
Figure 5: Shuffle transformation implementation
Garble begins by generating two types of keys: a primary key of equal length to the input string for data encryption and a smaller index key (between two and 16 bytes) for index scrambling. The transformation process then occurs in the following four steps:
Initial encryption: Each byte of the input data is encrypted using a randomly generated reversible operator with its corresponding key byte.
Data interleaving: The encrypted data and key bytes are combined into a single buffer, with encrypted data in the first half and corresponding keys in the second half.
Index permutation: The key-data buffer undergoes a random permutation, scattering both the encrypted data and keys throughout the buffer.
Index encryption: Access to the permuted data is further obfuscated by XOR-ing the permuted indices with randomly selected bytes from the index key.
Figure 6 shows the decompiled code produced by IDA of a decrypting subroutine of the shuffle transformation.
Figure 6: Decompiled code of a shuffle transformation decrypting subroutine
Seed Transformation
The seed transformation implements a chained encoding scheme where each byte’s encryption depends on the previous encryptions through a continuously updated seed value. Figure 7 shows the implementation from the garble repository.
// Generate random initial seed value
seed := byte(obfRand.Uint32())
// Store original seed for later use in decryption
originalSeed := seed
// Select a random reversible operator for encryption
op := randOperator(obfRand)
var callExpr *ast.CallExpr
// Encrypt each byte while building chain of function calls
for i, b := range data {
// Encrypt current byte using current seed value
encB := evalOperator(op, b, seed)
// Update seed by adding encrypted byte
seed += encB
if i == 0 {
// Start function call chain with first encrypted byte
callExpr = ah.CallExpr(ast.NewIdent("fnc"), ah.IntLit(int(encB)))
} else {
// Add subsequent encrypted bytes to function call chain
callExpr = ah.CallExpr(callExpr, ah.IntLit(int(encB)))
}
}
...
Figure 7: Seed transformation implementation
Garble begins by randomly generating a seed value to be used for encryption. As the compiler iterates through the input string, each byte is encrypted by applying the random operator with the current seed, and the seed is updated by adding the encrypted byte. In this seed transformation, each byte’s encryption depends on the result of the previous one, creating a chain of dependencies through the continuously updated seed.
In the decryption setup, as shown in the IDA decompiled code in Figure 8, the obfuscator generates a chain of calls to a decrypting function. For each encrypted byte starting with the first one, the decrypting function applies the operator to decrypt it with the current seed and updates the seed by adding the encrypted byte to it. Because of this setup, subroutines of this transformation type are easily recognizable in the decompiler and disassembly views due to the multiple function calls it makes in the decryption process.
Figure 8: Decompiled code of a seed transformation decrypting subroutine
Figure 9: Disassembled code of a seed transformation decrypting subroutine
Split Transformation
The split transformation is one of the more sophisticated string transformation techniques by garble, implementing a multilayered approach that combines data fragmentation, encryption, and control flow manipulation. Figure 10 shows the implementation from the garble repository.
func (split) obfuscate(obfRand *mathrand.Rand, data []byte)
*ast.BlockStmt {
var chunks [][]byte
// For small input, split into single bytes
// This ensures even small payloads get sufficient obfuscation
if len(data)/maxChunkSize < minCaseCount {
chunks = splitIntoOneByteChunks(data)
} else {
chunks = splitIntoRandomChunks(obfRand, data)
}
// Generate random indexes for all chunks plus two special cases:
// - One for the final decryption operation
// - One for the exit condition
indexes := obfRand.Perm(len(chunks) + 2)
// Initialize the decryption key with a random value
decryptKeyInitial := byte(obfRand.Uint32())
decryptKey := decryptKeyInitial
// Calculate the final decryption key by XORing it with
position-dependent values
for i, index := range indexes[:len(indexes)-1] {
decryptKey ^= byte(index * i)
}
// Select a random reversible operator for encryption
op := randOperator(obfRand)
// Encrypt all data chunks using the selected operator and key
encryptChunks(chunks, op, decryptKey)
// Get special indexes for decrypt and exit states
decryptIndex := indexes[len(indexes)-2]
exitIndex := indexes[len(indexes)-1]
// Create the decrypt case that reassembles the data
switchCases := []ast.Stmt{&ast.CaseClause{
List: []ast.Expr{ah.IntLit(decryptIndex)},
Body: shuffleStmts(obfRand,
// Exit case: Set next state to exit
&ast.AssignStmt{
Lhs: []ast.Expr{ast.NewIdent("i")},
Tok: token.ASSIGN,
Rhs: []ast.Expr{ah.IntLit(exitIndex)},
},
// Iterate through the assembled data and decrypt each byte
&ast.RangeStmt{
Key: ast.NewIdent("y"),
Tok: token.DEFINE,
X: ast.NewIdent("data"),
Body: ah.BlockStmt(&ast.AssignStmt{
Lhs: []ast.Expr{ah.IndexExpr("data", ast.NewIdent("y"))},
Tok: token.ASSIGN,
Rhs: []ast.Expr{
// Apply the reverse of the encryption operation
operatorToReversedBinaryExpr(
op,
ah.IndexExpr("data", ast.NewIdent("y")),
// XOR with position-dependent key
ah.CallExpr(ast.NewIdent("byte"), &ast.BinaryExpr{
X: ast.NewIdent("decryptKey"),
Op: token.XOR,
Y: ast.NewIdent("y"),
}),
),
},
}),
},
),
}}
// Create switch cases for each chunk of data
for i := range chunks {
index := indexes[i]
nextIndex := indexes[i+1]
chunk := chunks[i]
appendCallExpr := &ast.CallExpr{
Fun: ast.NewIdent("append"),
Args: []ast.Expr{ast.NewIdent("data")},
}
...
// Create switch case for this chunk
switchCases = append(switchCases, &ast.CaseClause{
List: []ast.Expr{ah.IntLit(index)},
Body: shuffleStmts(obfRand,
// Set next state
&ast.AssignStmt{
Lhs: []ast.Expr{ast.NewIdent("i")},
Tok: token.ASSIGN,
Rhs: []ast.Expr{ah.IntLit(nextIndex)},
},
// Append this chunk to the collected data
&ast.AssignStmt{
Lhs: []ast.Expr{ast.NewIdent("data")},
Tok: token.ASSIGN,
Rhs: []ast.Expr{appendCallExpr},
},
),
})
}
// Final block creates the state machine loop structure
return ah.BlockStmt(
...
// Update decrypt key based on current state and counter
Body: ah.BlockStmt(
&ast.AssignStmt{
Lhs: []ast.Expr{ast.NewIdent("decryptKey")},
Tok: token.XOR_ASSIGN,
Rhs: []ast.Expr{
&ast.BinaryExpr{
X: ast.NewIdent("i"),
Op: token.MUL,
Y: ast.NewIdent("counter"),
},
},
},
// Main switch statement as the core of the state machine
&ast.SwitchStmt{
Tag: ast.NewIdent("i"),
Body: ah.BlockStmt(shuffleStmts(obfRand, switchCases...)...),
}),
Figure 10: Split transformation implementation
The transformation begins by splitting the input string into chunks of varying sizes. Shorter strings are broken into individual bytes, while longer strings are divided into random-sized chunks of up to four bytes.
The transformation then constructs a decrypting mechanism using a switch-based control flow pattern. Rather than processing chunks sequentially, the compiler generates a randomized execution order through a series of switch cases. Each case handles a specific chunk of data, encrypting it with a position-dependent key derived from both the chunk’s position and a global encryption key.
In the decryption setup, as shown in the IDA decompiled code in Figure 11, the obfuscator first collects the encrypted data by going through each chunk in their corresponding order. In the final switch case, the compiler performs a final pass to XOR-decrypt the encrypted buffer. This pass uses a continuously updated key that depends on both the byte position and the execution path taken through the switch statement to decrypt each byte.
Figure 11: Decompiled code of a split transformation decrypting subroutine
GoStringUngarbler: Automatic String Deobfuscator
To systematically approach string decryption automation, we first consider how this can be done manually. From our experience, the most efficient manual approach leverages dynamic analysis through a debugger. Upon finding a decrypting subroutine, we can manipulate the program counter to target the subroutine’s entry point, execute until the ret instruction, and extract the decrypted string from the return buffer.
To perform this process automatically, the primary challenge lies in identifying all decrypting subroutines introduced by garble’s transformations. Our analysis revealed a consistent pattern—decrypted strings are always processed through Go’s runtime_slicebytetostring function before being returned by the decrypting subroutine. This observation provides a reliable anchor point, allowing us to construct regular expression (regex) patterns to automatically detect these subroutines.
String Encryption Subroutine Patterns
Through analyzing the disassembled code, we have identified consistent instruction patterns for each string transformation variant. For each transformation on 64-bit binaries, rbx is used to store the decrypted string pointer, and rcx is assigned with the length of the decrypted string. The main difference between the transformations is the way these two registers are populated before the call to runtime_slicebytetostring.
Figure 12: Epilogue patterns of garble’sdecrypting subroutines
Through the assembly patterns in Figure 12, we develop regex patterns corresponding to each of garble’s transformation types, which allows us to automatically identify string decrypting subroutines with high precision.
To extract the decrypted string, we must find the subroutine’s prologue and perform instruction-level emulation from this entry point until runtime_slicebytestring is called. For binaries of Go versions v1.21 to v1.23, we observe two main patterns of instructions in the subroutine prologue that perform the Go stack check.
Figure 13: Prologue instruction patterns of Go subroutines
These instruction patterns in the Go prologue serve as reliable entry point markers for emulation. The implementation in GoStringUngarbler leverages these structural patterns to establish reliable execution contexts for the unicorn emulation engine, ensuring accurate string recovery across various garble string transformations.
Figure 14 shows the output of our automated extraction framework, where GoStringUngarbleris able to identify and emulate all decrypting subroutines.
From these instruction patterns, we have derived a YARA rule for detecting samples that are obfuscated with garble’s literal transformation. The rule can be found in Mandiant’s GitHub repository.
Deobfuscation: Subroutine Patching
While extracting obfuscated strings can aid malware detection through signature-based analysis, this alone is not useful for reverse engineers conducting static analysis. To aid reverse engineering efforts, we’ve implemented a binary deobfuscation approach leveraging the emulation results.
Although developing an IDA plugin would have streamlined our development process, we recognize that not all malware analysts have access to, or prefer to use, IDA Pro. To make our tool more accessible, we developed GoStringUngarbler as a standalone Python utility to process binaries protected by garble. The tool can deobfuscate and produce functionally identical executables with recovered strings stored in plain text, improving both reverse engineering analysis and malware detection workflows.
For each identified decrypting subroutine, we implement a strategic patching methodology, replacing the original code with an optimized stub while padding the remaining subroutine space with INT3 instructions (Figure 15).
xor eax, eax ; clear return register
lea rbx, <string addr> ; Load effective address of decrypted string
mov ecx, <string len> ; populate string length
call runtime_slicebytetostring ; convert slice to Go string
ret ; return the decrypted string
Figure 15: Function stub to patch over garble’s decrypting subroutines
Initially, we considered storing recovered strings within an existing binary section for efficient referencing from the patched subroutines. However, after examining obfuscated binaries, we found that there is not enough space within existing sections to consistently accommodate the deobfuscated strings. On the other hand, adding a new section, while feasible, would introduce unnecessary complexity to our tool.
Instead, we opt for a more elegant space utilization strategy by leveraging the inherent characteristics of garble’s string transformations. In our tool, we implement in-place string storage by writing the decrypted string directly after the patched stub, capitalizing on the guaranteed available space from decrypting routines:
Stack transformation: The decrypting subroutine stores and processes encrypted strings on the stack, providing adequate space through their data manipulation instructions. The instructions originally used for pushing encrypted data onto the stack create a natural storage space for the decrypted string.
Seed transformation: For each character, the decrypting subroutine requires a call instruction to decrypt it and update the seed. This is more than enough space to store the decrypted bytes.
Split transformation: The decrypting subroutine contains multiple switch cases to handle fragmented data recovery and decryption. These extensive instruction sequences guarantee sufficient space for the decrypted string data.
Figure 16 and Figure 17 show the disassembled and decompiled output of our patching framework, where GoStringUngarblerhas deobfuscated a decrypting subroutine to display the recovered original string.
Figure 16: Disassembly view of a deobfuscated decrypting subroutine
Figure 17: Decompiled view of a deobfuscated decrypting subroutine
Downloading GoStringUngarbler
GoStringUngarbleris now available as an open-source tool in Mandiant’s GitHub repository.
The installation requires Python3 and Python dependencies from the requirements.txtfile.
Future Work
Deobfuscating binaries generated by garblepresents a specific challenge—its dependence on the Go compiler for obfuscation means that the calling convention can evolve between Go versions. This change can potentially invalidate the regular expression patterns used in our deobfuscation process. To mitigate this, we’ve designed GoStringUngarblerwith a modular plugin architecture. This allows for new plugins to be easily added with updated regular expressions to handle variations introduced by new Go releases. This design ensures the tool’s long-term adaptability to future changes in garble’s output.
Currently, GoStringUngarblerprimarily supports garble–obfuscated PE and ELF binaries compiled with Go versions 1.21 through 1.23. We are continuously working to expand this range as the Go compiler and garble are updated.
Acknowledgments
Special thanks to Nino Isakovic and Matt Williams for their review and continuous feedback throughout the development of GoStringUngarbler. Their insights and suggestions have been invaluable in shaping and refining the tool’s final implementation.
We are also grateful to the FLARE team members for their review of this blog post publication to ensure its technical accuracy and clarity.
Finally, we want to acknowledge the developers of garble for their outstanding work on this obfuscating compiler. Their contributions to the software protection field have greatly advanced both offensive and defensive security research on Go binary analysis.
Unico is a leading biometric verification and authentication company addressing the global challenges of identity management and fraud prevention.
With nearly two decades of experience in the Brazilian market, Unico has become a reliable supplier to over 800 companies, including four of the top five largest banks and leading retailers. Since 2021, Unico has facilitated more than 1.2 billion authentications through digital identity. It is estimated that Unico’s solutions have thwarted $14 billion in fraud, by 2023. Valued at over $2.6 billion, the company stands as the second most valuable SaaS company in Latin America, backed by General Atlantics, SoftBank, and Goldman Sachs, and was recognized as the third most innovative company in Latin America by Fast Company in 2024.
Currently, working on its global expansion, Unico has an ambitious vision to become the main identity network in the world, thus moving beyond traditional ID verification and embracing a broader spectrum of identity-related technologies. In this article, we’ll explore how Google Cloud and Spanner — Google’s always-on, virtually unlimited-scale database — is helping Unico achieve this goal.
Why vector search shines in Unico’s solutions
Unico is committed to delivering innovative, cutting-edge digital identity solutions. A cornerstone of this effort is the use of vector search technology, which enables powerful capabilities like 1:N search — the ability to search for a single face within a large set of many others. This technology drives Unico’s identity solutions by retrieving and ranking multiple relevant matches for a given query with high precision and speed.
However, developing 1:N searches poses a significant challenge: efficiently verifying facial matches within databases containing millions or billions of registered face vectors. Comparing an individual’s facial characteristics against each entry one by one is impractical. To address this, vector databases are often employed to perform Approximate Nearest Neighbor searches (ANN) and return the top-N most similar faces.
Unico found that Spanner supports vector search capabilities to solve these issues, providing:
Semantic retrieval: Leveraging vector embeddings, Unico’s solutions can retrieve results based on deeper semantic relationships rather than exact matches. This improves the quality of identity verification, such as identifying relevant facial matches even when minor variations exist between the source and target images.
Diversity and relevance: Using algorithms like ANN and exact K-Nearest Neighbors (KNN) vector search balances the need for diverse and relevant results, ensuring high reliability in fraud detection and identity verification.
Multimodal applications: Vector search supports embeddings from multiple data types, such as text, images, and audio, enabling its use in complex, multimodal identity scenarios.
Hybrid search: Modern vector search frameworks combine similarity search with metadata filters, allowing tailored results based on context, such as region or user preferences.
By integrating vector search, Unico provides customers with faster and smarter fraud detection tools. Leveraging high-precision algorithms, these tools can identify fraudulent faces with exceptional accuracy, effectively safeguarding businesses and individuals against identity theft and other threats. This innovation not only solidifies Unico’s position as a technology leader but also underscores its mission to build a safer, and more trusted world by creating a unified ecosystem to validate people’s real identities.
aside_block
<ListValue: [StructValue([(‘title’, ‘$300 in free credit to try Google Cloud databases’), (‘body’, <wagtail.rich_text.RichText object at 0x3e3deaa96ca0>), (‘btn_text’, ‘Start building for free’), (‘href’, ‘http://console.cloud.google.com/freetrial?redirectPath=/products?#databases’), (‘image’, None)])]>
Some results
Operating at low latency while maintaining accuracy is crucial for Unico’s business, especially in applications that demand real-time performance, such as banking. Spanner was Unico’s first choice because its integrated support for vector search eliminates the need for separate, specialized vector database solutions.
Spanner provides transactional guarantees for operational data, delivers fresh and consistent vector search results, and offers horizontal scalability. Its features also include GRPC (Google Remote Procedure Call) support, geo partitioning, multi-region storage configuration, RAG and LLM integrations, high SLA levels (99.99%), and maintenance-free architecture. Spanner also currently supports KNN and ANN vector searches.
Unico currently operates 1:N services in Brazil and Mexico, storing more than 1 billion facial embeddings in Spanner to date. This setup enables Unico to achieve low latency at high percentiles, high throughput of 840 RPM, and a precision/recall of 96%. And it’s just the start — Unico processes around 35 million new faces every month and that number continues to grow.
Unico remains focused on growing its customer base, enhancing its existing products, and exploring new opportunities in international markets — with the aim of expanding the reach of its secure digital identity services beyond Brazil’s borders. With Spanner and the ability to tap into the full power of the Google Cloud’s ecosystem, Unico is confident that it can bring its ambitious vision to life and deliver innovative solutions that forge trust between people and companies.
We’re pleased to announce that Google has been recognized as a Leader in The Forrester Wave™: Data Security Platforms, Q1 2025 report. We believe this is a testament to our unwavering commitment to providing cutting-edge data security in the cloud.
In today’s AI era, comprehensive data security is paramount. Organizations are grappling with increasingly sophisticated threats, growing data volumes, and the complexities of managing data across diverse environments. That’s why a holistic, integrated approach to data security is no longer a nice-to-have — it’s a necessity.
A vision driven by customer needs and market trends
Our vision for data security is directly aligned with the evolving needs of our customers and the broader market. This vision is built on five key pillars:
We see cloud as the place where most critical business data lives, therefore we continue to build ubiquitous, platform-level controls and capabilities for data security, while working to centralize administration and governance capabilities.
We engineer security directly at each layer of the new AI technology stack and throughout the entire data lifecycle to secure the intersection of data and new AI systems.
We see the continued efforts of nation-state and criminal actors targeting sensitive enterprise data, which drives increased need for comprehensive data security posture management, better risk-based prioritization, and use of frontline intelligence to prevent, detect and disrupt sophisticated attacks.
We see increasing mandates for data security, privacy, and sovereignty, therefore we continue to expand capabilities for audit, governance, and specific sovereign controls.
We must account for ongoing technology change, addressing new attack vectors such as adversarial AI and the emergence of quantum computing technology than can obsolete foundational controls.
“Google differentiates with data threat and risk visibility, access controls, masking, encryption, and addressing supplier risk. It is superior for privacy (including confidential computing), information governance, and AI security and governance use cases,” wrote Forrester in their report.
aside_block
<ListValue: [StructValue([(‘title’, ‘$300 in free credit to try Google Cloud security products’), (‘body’, <wagtail.rich_text.RichText object at 0x3e3e10f71c70>), (‘btn_text’, ‘Start building for free’), (‘href’, ‘http://console.cloud.google.com/freetrial?redirectPath=/welcome’), (‘image’, None)])]>
Building on strengths
Google received the highest scores possible in 10 criteria, including: Vision, Innovation, Data threat and risk visibility, Data access controls, Data masking or redaction, Encryption, Supplier risk, and Use cases for privacy, Information governance, and AI security and governance.
“Organizations focused on going all-in on cloud and Zero Trust — especially those innovating with data and AI — that desire an integrated experience should consider Google,” the report states. As AI adoption accelerates, the need for a data security platform that can protect sensitive data while boosting innovation is paramount.
Learn more
We invite you toread the full report to understand why Google Cloud is a leader in this space and how we can help your organization. This independent analysis provides valuable insights as you evaluate your data security strategy. We’re excited to continue this journey with you.
Forrester does not endorse any company, product, brand, or service included in its research publications and does not advise any person to select the products or services of any company or brand based on the ratings included in such publications. Information is based on the best available resources. Opinions reflect judgment at the time and are subject to change. For more information, read about Forrester’s objectivity here .
A few weeks ago, Google DeepMind released Gemini 2.0 for everyone, including Gemini 2.0 Flash, Gemini 2.0 Flash-Lite, and Gemini 2.0 Pro (Experimental). All models support up to at least 1 million input tokens, which makes it easier to do a lot of things – from image generation to creative writing. It’s also changed how we convert documents into structured data. Manual document processing is a slow and expensive problem, but Gemini 2.0 changed everything when it comes to chunking pdfs for RAG systems, and can even transform pdfs into insights.
Today, we’ll take a deep dive into a multi-step approach using generative AI where you can use Gemini 2.0 to improve your document extraction by combining language models (LLMs) with structured, externalized rules.
A multi-step approach to document extraction, made easy
A multi-step architecture, as opposed to relying on a single, monolithic prompt, offers significant advantages for robust extraction. This approach begins with modular extraction, where initial tasks are broken down into smaller, more focused prompts targeting specific content locations within a document. This modularity not only enhances accuracy but also reduces the cognitive load on the LLM.
Another benefit of a multi-step approach is externalized rule management. By managing post-processing rules externally, for instance, using Google Sheets or a BigQuery table, we gain the benefits of easy CRUD (Create, Read, Update, Delete) operations, improving both maintainability and version control of the rules. This decoupling also separates the logic of extraction from the logic of processing, allowing for independent modification and optimization of each.
Ultimately, this hybrid approach combines the strengths of LLM-powered extraction with a structured rules engine. LLMs handle the complexities of understanding and extracting information from unstructured data, while the rules engine provides a transparent and manageable system for enforcing business logic and decision-making. The following steps outline a practical implementation.
aside_block
<ListValue: [StructValue([(‘title’, ‘$300 in free credit to try Google Cloud AI and ML’), (‘body’, <wagtail.rich_text.RichText object at 0x3e436dc40100>), (‘btn_text’, ‘Start building for free’), (‘href’, ‘http://console.cloud.google.com/freetrial?redirectPath=/vertex-ai/’), (‘image’, None)])]>
Step 1: Extraction
Let’s test a sample prompt with a configurable set of rules. This hands-on example will demonstrate how easily you can define and apply business logic to extracted data, all powered by the Gemini and Vertex AI.
First, we extract data from a document. Let’s use Google’s 2023 Environment Report as the source document. We use Gemini with the initial prompt to extract data. This is not a known schema, but a prompt we’ve created for the purposes of this story. To create specific response schemas, use controlled generation with Gemini.
code_block
<ListValue: [StructValue([(‘code’, ‘<PERSONA>rnYou are a meticulous AI assistant specializing in extracting key sustainability metrics and performance data from corporate environmental reports. Your task is to accurately identify and extract specific data points from a provided document, ensuring precise values and contextual information are captured. Your analysis is crucial for tracking progress against sustainability goals and supporting informed decision-making.rnrn<INSTRUCTIONS>rnrn**Task:**rnAnalyze the provided Google Environmental Report 2023 (PDF) and extract the following `key_metrics`. For each metric:rnrn1. **`metric_id`**: A short, unique identifier for the metric (provided below).rn2. **`description`**: A brief description of the metric (provided below).rn3. **`value`**: The numerical value of the metric as reported in the document. Be precise (e.g., “10.2 million”, not “about 10 million”). If a range is given, and a single value is not clearly indicated, you must use the largest of the range.rn4. **`unit`**: The unit of measurement for the metric (e.g., “tCO2e”, “million gallons”, “%”). Use the units exactly as they appear in the report.rn5. **`year`**: The year to which the metric applies (2022, unless otherwise specified).rn6. **`page_number`**: The page number(s) where the metric’s value is found. If the information is spread across multiple pages, list all relevant pages, separated by commas. If the value requires calculations based on the page, list the final answer page.rn7. **`context`**: One sentance to put the metric in context.rn**Metrics to Extract:**rnrn“`jsonrn[rn {rn “metric_id”: “ghg_emissions_total”,rn “description”: “Total GHG Emissions (Scope 1, 2 market-based, and 3)”,rn },rn {rn “metric_id”: “ghg_emissions_scope1”,rn “description”: “Scope 1 GHG Emissions”,rn },rn {rn “metric_id”: “ghg_emissions_scope2_market”,rn “description”: “Scope 2 GHG Emissions (market-based)”,rn },rn {rn “metric_id”: “ghg_emissions_scope3_total”,rn “description”: “Total Scope 3 GHG Emissions”,rn },rn {rn “metric_id”: “renewable_energy_capacity”,rn “description”: “Clean energy generation capacity from signed agreements (2010-2022)”,rn },rn {rn “metric_id”: “water_replenishment”,rn “description”: “Water replenished”,rn },rn {rn “metric_id”: “water_consumption”,rn “description”: “Water consumption”,rn },rn {rn “metric_id”: “waste_diversion_landfill”,rn “description”: “Percentage of food waste diverted from landfill”,rn },rn {rn “metric_id”: “recycled_material_plastic”,rn “description”: “Percentage of plastic used in manufactured products that was recycled content”,rn },rn {rn “metric_id”: “packaging_plastic_free”,rn “description”: “Percentage of product packaging that is plastic-free”,rn }rn]’), (‘language’, ‘lang-py’), (‘caption’, <wagtail.rich_text.RichText object at 0x3e436dc40be0>)])]>
The JSON output below, which we’ll assign to the variable `extracted_data`, represents the results of the initial data extraction by Gemini. This structured data is now ready for the next critical phase: applying our predefined business rules.
code_block
<ListValue: [StructValue([(‘code’, ‘extracted_data= [rn {rn “metric_id”: “ghg_emissions_total”,rn “description”: “Total GHG Emissions (Scope 1, 2 market-based, and 3)”,rn “value”: “14.3 million”,rn “unit”: “tCO2e”,rn “year”: 2022,rn “page_number”: “23”,rn “context”: “In 2022 Google’s total GHG emissions, including Scope 1, 2 (market-based), and 3, amounted to 14.3 million tCO2e.”rn },rn {rn “metric_id”: “ghg_emissions_scope1”,rn “description”: “Scope 1 GHG Emissions”,rn “value”: “0.23 million”,rn “unit”: “tCO2e”,rn “year”: 2022,rn “page_number”: “23”,rn “context”: “In 2022, Google’s Scope 1 GHG emissions were 0.23 million tCO2e.”rn },rn {rn “metric_id”: “ghg_emissions_scope2_market”,rn “description”: “Scope 2 GHG Emissions (market-based)”,rn “value”: “0.03 million”,rn “unit”: “tCO2e”,rn “year”: 2022,rn “page_number”: “23”,rn “context”: “Google’s Scope 2 GHG emissions (market-based) in 2022 totaled 0.03 million tCO2e.”rn },rn {rn “metric_id”: “ghg_emissions_scope3_total”,rn “description”: “Total Scope 3 GHG Emissions”,rn “value”: “14.0 million”,rn “unit”: “tCO2e”,rn “year”: 2022,rn “page_number”: “23”,rn “context”: “Total Scope 3 GHG emissions for Google in 2022 reached 14.0 million tCO2e.”rn },rn {rn “metric_id”: “renewable_energy_capacity”,rn “description”: “Clean energy generation capacity from signed agreements (2010-2022)”,rn “value”: “7.5”,rn “unit”: “GW”,rn “year”: 2022,rn “page_number”: “14”,rn “context”: “By the end of 2022, Google had signed agreements for a clean energy generation capacity of 7.5 GW since 2010.”rn },rn {rn “metric_id”: “water_replenishment”,rn “description”: “Water replenished”,rn “value”: “2.4 billion”,rn “unit”: “gallons”,rn “year”: 2022,rn “page_number”: “30”,rn “context”: “Google replenished 2.4 billion gallons of water in 2022.”rn },rn {rn “metric_id”: “water_consumption”,rn “description”: “Water consumption”,rn “value”: “3.4 billion”,rn “unit”: “gallons”,rn “year”: 2022,rn “page_number”: “30”,rn “context”: “In 2022 Google’s water consumption totalled 3.4 billion gallons.”rn },rn {rn “metric_id”: “waste_diversion_landfill”,rn “description”: “Percentage of food waste diverted from landfill”,rn “value”: “70”,rn “unit”: “%”,rn “year”: 2022,rn “page_number”: “34”,rn “context”: “Google diverted 70% of its food waste from landfills in 2022.”rn },rn {rn “metric_id”: “recycled_material_plastic”,rn “description”: “Percentage of plastic used in manufactured products that was recycled content”,rn “value”: “50”,rn “unit”: “%”,rn “year”: 2022,rn “page_number”: “32”,rn “context”: “In 2022 50% of plastic used in manufactured products was recycled content.”rn },rn {rn “metric_id”: “packaging_plastic_free”,rn “description”: “Percentage of product packaging that is plastic-free”,rn “value”: “34”,rn “unit”: “%”,rn “year”: 2022,rn “page_number”: “32”,rn “context”: “34% of Google’s product packaging was plastic-free in 2022.”rn }rn]’), (‘language’, ‘lang-py’), (‘caption’, <wagtail.rich_text.RichText object at 0x3e436dc400d0>)])]>
Step 2: Feed the extracted data into a rules engine
Next, we’ll feed this `extracted_data` into a rules engine, which, in our implementation, is another call to Gemini, acting as a powerful and flexible rules processor. Along with the extracted data, we’ll provide a set of validation rules defined in the `analysis_rules` variable. This engine, powered by Gemini, will systematically check the extracted data for accuracy, consistency, and adherence to our predefined criteria. Below is the prompt we provide to Gemini to accomplish this, along with the rules themselves.
code_block
<ListValue: [StructValue([(‘code’, “<PERSONA>rnYou are a sustainability data analyst responsible for verifying the accuracy and consistency of extracted data from corporate environmental reports. Your task is to apply a set of predefined rules to the extracted data to identify potential inconsistencies, highlight areas needing further investigation, and assess progress towards stated goals. You are detail-oriented and understand the nuances of sustainability reporting.rnrn<INSTRUCTIONS>rnrn**Input:**rnrn1. `extracted_data`: (JSON) The `extracted_data` variable contains the values extracted from the Google Environmental Report 2023, as provided in the previous turn. This is the output from the first Gemini extraction.rn2. `analysis_rules`: (JSON) The `analysis_rules` variable contains a JSON string defining a set of rules to apply to the extracted data. Each rule includes a `rule_id`, `description`, `condition`, `action`, and `alert_message`.rnrn**Task:**rnrn1. **Iterate through Rules:** Process each rule defined in the `analysis_rules`.rn2. **Evaluate Conditions:** For each rule, evaluate the `condition` using the data in `extracted_data`. Conditions may involve:rn * Accessing specific `metric_id` values within the `extracted_data`.rn * Comparing values across different metrics.rn * Checking for data types (e.g., ensuring a value is a number).rn * Checking page numbers for consistency.rn * Using logical operators (AND, OR, NOT) and mathematical comparisons (>, <, >=, <=, ==, !=).rn * Checking for the existence of data.rn3. **Execute Actions:** If a rule’s condition evaluates to TRUE, execute the `action` specified in the rule. The action describes *what* the rule is checking.rn4. **Trigger Alerts:** If the condition is TRUE, generate the `alert_message` associated with that rule. Include relevant `metric_id` values and page numbers in the alert message to provide context.rnrn**Output:**rnrnReturn a JSON array containing the triggered alerts. Each alert should be a dictionary with the following keys:rnrn* `rule_id`: The ID of the rule that triggered the alert.rn* `alert_message`: The alert message, potentially including specific values from the `extracted_data`.”), (‘language’, ‘lang-py’), (‘caption’, <wagtail.rich_text.RichText object at 0x3e436dc401c0>)])]>
`analysis_rules` is a JSON object that contains the business rules we want to apply to the extracted receipt data. Each rule defines a specific condition to check, an action to take if the condition is met, and an optional alert message if a violation occurs. The power of this approach lies in the flexibility of these rules; you can easily add, modify, or remove them without altering the core extraction process. The beauty of using Gemini is that the rules can be written in human-readable language and can be maintained by non-coders.
code_block
<ListValue: [StructValue([(‘code’, ‘analysis_rules = {rn “rules”: [rn {rn “rule_id”: “AR001”,rn “description”: “Check if all required metrics were extracted.”,rn “condition”: “extracted_data contains all metric_ids from the original extraction prompt”,rn “action”: “Verify the presence of all expected metrics.”,rn “alert_message”: “Missing metrics in the extracted data. The following metric IDs are missing: {missing_metrics}”rn },rn {rn “rule_id”: “AR002”,rn “description”: “Check if total GHG emissions equal the sum of Scope 1, 2, and 3.”,rn “condition”: “extracted_data[‘ghg_emissions_total’][‘value’] != (extracted_data[‘ghg_emissions_scope1’][‘value’] + extracted_data[‘ghg_emissions_scope2_market’][‘value’] + extracted_data[‘ghg_emissions_scope3_total’][‘value’]) AND extracted_data[‘ghg_emissions_total’][‘page_number’] == extracted_data[‘ghg_emissions_scope1’][‘page_number’] == extracted_data[‘ghg_emissions_scope2_market’][‘page_number’] == extracted_data[‘ghg_emissions_scope3_total’][‘page_number’]”,rn “action”: “Sum Scope 1, 2, and 3 emissions and compare to the reported total.”,rn “alert_message”: “Inconsistency detected: Total GHG emissions ({total_emissions} {total_unit}) on page {total_page} do not equal the sum of Scope 1 ({scope1_emissions} {scope1_unit}), Scope 2 ({scope2_emissions} {scope2_unit}), and Scope 3 ({scope3_emissions} {scope3_unit}) emissions on page {scope1_page}. Sum is {calculated_sum}”rn },rn {rn “rule_id”: “AR003”,rn “description”: “Check for unusually high water consumption compared to replenishment.”,rn “condition”: “extracted_data[‘water_consumption’][‘value’] > (extracted_data[‘water_replenishment’][‘value’] * 5) AND extracted_data[‘water_consumption’][‘unit’] == extracted_data[‘water_replenishment’][‘unit’]”,rn “action”: “Compare water consumption to water replenishment.”,rn “alert_message”: “High water consumption: Consumption ({consumption_value} {consumption_unit}) is more than five times replenishment ({replenishment_value} {replenishment_unit}) on page {consumption_page} and {replenishment_page}.”rn }rn ]rn}’), (‘language’, ”), (‘caption’, <wagtail.rich_text.RichText object at 0x3e436dc402e0>)])]>
Step 3: Integrate your insights
Finally – and crucially – integrate the alerts and insights generated by the rules engine into existing data pipelines and workflows. This is where the real value of this multi-step process is unlocked. For our example, we can build robust APIs and systems using Google Cloud tools to automate downstream actions triggered by the rule-based analysis. Some examples of downstream tasks are:
Automated task creation: Trigger Cloud Functions to create tasks in project management systems, assigning data verification to the appropriate teams.
Data quality pipelines: Integrate with Dataflow to flag potential data inconsistencies in BigQuery tables, triggering validation workflows.
Vertex AI integration: Leverage Vertex AI Model Registry for tracking data lineage and model performance related to extracted metrics and corrections made.
Dashboard integration Use Looker, Google Sheets, or Data Studio to display alerts
Human in the loop trigger: Build a trigger system for the Human in the loop, using Cloud Tasks, to show which extractions to focus on and double check.
Make document extraction easier today
This hands-on approach provides a solid foundation for building robust, rule-driven document extraction pipelines. To get started, explore these resources:
Gemini for document understanding: For a comprehensive, one-stop solution to your document processing needs, check out Gemini for document understanding. It simplifies many common extraction challenges.
Few-shot prompting: Begin your Gemini journey withfew-shot prompting. This powerful technique can significantly improve the quality of your extractions with minimal effort, providing examples within the prompt itself.
Fine-tuning Gemini models: When you need highly specialized, domain-specific extraction results, consider fine-tuning Gemini models. This allows you to tailor the model’s performance to your exact requirements.
Cloud SQL, Google Cloud’s fully managed database service for PostgreSQL, MySQL, and SQL Server workloads, offers strong availability SLAs, depending on which edition you choose: a 99.95% SLA, excluding maintenance for Enterprise edition; and a 99.99% SLA, including maintenance for Enterprise Plus. In addition, Cloud SQL offers numerous high availability and scalability features that are crucial for maintaining business continuity and minimizing downtime, especially for mission-critical databases.
These features can help address some common database deployment challenges:
Combined read/write instances: Using a single instance for both reads and writes creates a single point of failure. If the primary instance goes down, both read and write operations are impacted. In the event that your storage is full and auto-scaling is disabled, even a failover would not help.
Downtime during maintenance: Planned maintenance can disrupt business operations.
Time-consuming scaling: Manually scaling instance size for planned workload spikes is a lengthy process that requires significant planning.
Complex cross-region disaster recovery: Setting up and managing cross-region DR requires manual configuration and connection string updates after a failover.
In this blog, we show you how to maximize your business continuity efforts with Cloud SQL’s high availability and scalability features, as well as how to use Cloud SQL Enterprise Plus features to build resilient database architectures that can handle workload spikes, unexpected outages, and read scaling needs.
Architecting a highly available and robust database
Using the Cloud SQL high availability feature, which automatically fails over to a standby instance, is a good starting point but not sufficient: scenarios such as storage full issues, regional outages, or failover problems can still cause disruptions. Separating read workloads from write workloads is essential for a more robust architecture.
A best-practice approach involves implementing Cloud SQL read replicas alongside high availability. Read traffic should be directed to dedicated read-replica instances, while write operations are handled by the primary instance. You can enable high availability either on the primary, the read replica(s), or both, depending on your specific requirements. This separation helps ensure that the primary can serve production traffic predictably, and that read operations can continue uninterrupted via the read replicas even when there is downtime.
Below is a sample regional architecture with high availability and read-replica enabled.
You can deploy this architecture regionally across multiple zones or extend it cross-regionally for disaster recovery and geographically-distributed read access. A regional deployment with a highly available primary and a highly available read replica that spans three availability zones provides resilience against zonal failures: Even if two zones fail, the database remains accessible for both read and write operations after failover. Cross-region read replicas enhance this further, providing regional DR capabilities.
aside_block
<ListValue: [StructValue([(‘title’, ‘$300 in free credit to try Google Cloud databases’), (‘body’, <wagtail.rich_text.RichText object at 0x3e43683c9280>), (‘btn_text’, ‘Start building for free’), (‘href’, ‘http://console.cloud.google.com/freetrial?redirectPath=/products?#databases’), (‘image’, None)])]>
Cloud SQL Enterprise Plus features
Cloud SQL Enterprise Plus offers significant advantages for performance and availability:
Enhanced hardware: Run databases on high-performance hardware with up to 128 vCPUs and 824GB of RAM.
Data cache: Enable data caching for faster read performance.
Near-zero downtime operations: Experience near-zero downtime maintenance and sub-second (<1s) downtime for instance scaling.
Advanced disaster recovery: Streamline disaster recovery with failover to cross-region DR-Replica and automatic reinstatement of the old primary. The application can still connect using the same write endpoint, which is automatically assigned to the new primary after failover.
Enterprise Plus edition addresses the previously mentioned challenges:
Improved performance: Benefit from higher core-to-memory ratios for better database performance.
Faster reads: Data caching improves read performance for read-heavy workloads. Read-cache can be enabled in the primary, the read-replica, or both as needed.
Easy scaling: Scale instances quickly with minimal downtime (sub-second) to handle traffic spikes or planned events. Scale the instance down when traffic is low with sub-second downtime.
Minimized maintenance downtime: Reduce downtime during maintenance to less than a second and provide better business continuity.
Handle regional failures: Easily fail over to a cross-region DR replica, and Cloud SQL automatically rebuilds your architecture as the original region recovers. This lessens the hassle of DR drills and helps ensure application availability.
Automatic IP address re-pointing: Leverage the write endpoint to automatically connect to the current primary after a switchover or failover and you don’t need to make any IP address changes on the application end.
To test out these benefits quickly, there’s an easy, near-zero downtime upgrade option from Cloud SQL Enterprise edition to Enterprise Plus edition.
Staging environment testing: To identify potential issues, use the maintenance timing feature to deploy maintenance to test/staging environments at least a week before production.
Read-replica maintenance: Apply self-service maintenance to one of the read replicas before the primary instance to avoid simultaneous downtime for read and write operations. Make sure that the primary and other replicas are updated shortly afterwards, as we recommend maintaining the same maintenance version in the primary as well as all the other replicas.
Maintenance window: Always configure a maintenance window during off-peak hours to control when maintenance is performed.
Maintenance notifications: Opt in to maintenance notifications to make sure you receive an email at least one week before scheduled maintenance.
Reschedule maintenance: Use the reschedule maintenance feature if a maintenance activity conflicts with a critical business period.
Deny maintenance period: Use the deny maintenance period feature to postpone maintenance for up to 90 days during sensitive periods.
By combining these strategies, you can build highly available and scalable database solutions in Cloud SQL, helping to ensure your business continuity and minimize downtime. Refer to the maintenance FAQ for more detailed information.
As a technology leader and a steward of company resources, understanding these costs isn’t just prudent – it’s essential for sustainable AI adoption. To help, we’ll unveil a comprehensive approach to understanding and managing your AI costs on Google Cloud, ensuring your organization captures maximum value from its AI investments.
Whether you’re just beginning your AI journey or scaling existing solutions, this approach will equip you with the insights needed to make informed decisions about your AI strategy.
Why understanding AI costs matters now
Google Cloud offers a vast and ever-expanding array of AI services, each with its own pricing structure. Without a clear understanding of these costs, you risk budget overruns, stalled projects, and ultimately, a failure to realize the full potential of your AI investments. This isn’t just about saving money; it’s about responsible AI development – building solutions that are both innovative and financially sustainable.
Breaking down the Total Cost of Ownership (TCO) for AI on Google Cloud
Let’s dissect the major cost components of running AI workloads on Google Cloud:
Cost category
Description
Google Cloud services (Examples)
Model serving cost
The cost of running your trained AI model to make predictions (inference). This is often a per-request or per-unit-of-time cost.
OOTB models available in Vertex AI, Vertex AI Prediction, GKE (if self-managing), Cloud Run Functions (for serverless inference)
Training and tuning costs
The expense of training your AI model on your data and fine-tuning it for optimal performance. This includes compute resources (GPUs/TPUs) and potentially the cost of the training data itself.
Vertex AI Training, Compute Engine (with GPUs/TPUs), GKE or Cloud Run (with GPUs/TPUs)
Cloud hosting costs
The fundamental infrastructure costs for running your AI application, including compute, networking, and storage.
Compute Engine, GKE or Cloud Run, Cloud Storage, Cloud SQL (if your application uses a database)
Training data storage and adapter layers costs
The cost of storing your training data and any “adapter layers” (intermediate representations or fine-tuned model components) created during the training process.
Cloud Storage, BigQuery
Application layer and setup costs
The expenses associated with any additional cloud services needed to support your AI application, such as API gateways, load balancers, monitoring tools, etc.
The ongoing costs of maintaining and supporting your AI model, including monitoring performance, troubleshooting issues, and potentially retraining the model over time.
Google Cloud Support, internal staff time, potential third-party monitoring tools
aside_block
<ListValue: [StructValue([(‘title’, ‘Try Google Cloud for free’), (‘body’, <wagtail.rich_text.RichText object at 0x3e436e50f250>), (‘btn_text’, ‘Get started for free’), (‘href’, ‘https://console.cloud.google.com/freetrial?redirectPath=/welcome’), (‘image’, None)])]>
Let’s estimate costs with an example
Let’s illustrate this with a hypothetical, yet realistic, generative AI use case: Imagine you’re a retail customer with an automated customer support chatbot.
Scenario: A medium-sized e-commerce company wants to deploy a chatbot on their website to handle common customer inquiries (order status, returns, product information and more). They plan to use a pre-trained language model (like one available through Vertex AI Model Garden) and fine-tune it on their own customer support data.
Assumptions:
Model: Fine-tuning a low latency language model (in this case we will use Gemini 1.5 Flash).
Training data: 1 million customer support conversations (text data).
Traffic: 100K chatbot interactions per day.
Hosting: Vertex AI Prediction for serving the model.
Fine-tuning frequency: Monthly.
Cost estimation
As the retail customer in this example, here’s how you might approach this.
1. First, discover your model serving cost:
Vertex AI Prediction (Gemini 1.5 Flash for Chat) pricing is modality-based pricing so in this case since our input and output is text, the usage unit will be characters. Let’s assume an average of 1000 input characters and 500 output characters per interaction.
Total model serving cost per month (~30 days): ~$337
Servicing cost of Gemini Flash 1.5 LLM model
2. Second, identify your training and tuning costs:
In this scenario, we aim to enhance the model’s accuracy and relevance to our specific use case through fine-tuning. This involves inputting a million past chat interactions, enabling the model to deliver more precise and customized interactions.
Cost per training tokens: $8 / M tokens
Cost per training characters: $2 / M characters (where each token approximately equates to 4 characters)
Tuning cost (subsequent month): 100,000 conversation (new training data) * 1500 characters (input + output) * 2 /1,000,000 = $300
3. Third, understand the cloud hosting costs:
Since we’re using Vertex AI Prediction, the underlying infrastructure is managed by Google Cloud. The cost is included in the per-request pricing. However, if we are self-managing the model on GKE or Compute Engine, we’d need to factor in VM costs, GPU/TPU costs (if applicable), and networking costs. For this example, we assume this is $0, as it is part of Vertex AI cost.
4. Fourth, define the training data storage and adapter layers costs:
The infrastructure costs for deploying machine learning models often raise concerns, but the data storage components can be economical at moderate scales. When implementing a conversational AI system, storing both the training data and the specialized model adapters represents a minor fraction of the overall costs. Let’s break down these storage requirements and their associated expenses.
1M conversations, assuming an average size of 5KB per conversation, would be roughly 5GB of data.
Cloud Storage cost for 5GB is negligible: $0.1 per month.
Adapter layers (fine-tuned model weights) might add another 1GB of storage. This would still be very inexpensive: $0.02 per month.
Total storage cost per month: < $1/month
5. Fifth, consider the application layer and setup costs:
This depends heavily on the specific application. In this case we are using Cloud Run Functions and Logging. Cloud Run to handle pre- and post-processing of chatbot requests (e.g., formatting, database lookups). In this case let’s assume we use request-based billing so we are only charged when it processes the request. In this example we are processing 3M requests per month (100K * 30) and assuming 1 sec for average execution time: $14.30
Cloud Run function cost for request-based billing
Cloud Logging and Monitoring for tracking chatbot performance and debugging issues. Let’s estimate 100GB of logging volume (which is on higher end) and retaining the logs for 3 months: $28
Cloud Logging costs for storage and retention
Total application layer cost per month:~ $40
6. Finally, incorporate the Operational support cost:
This is the hardest to estimate, as it depends on the internal team’s size and responsibilities. Let’s assume a conservative estimate of 5 hours per week of an engineer’s time dedicated to monitoring and maintaining the chatbot, at an hourly rate of $100.
Total operational support cost per month: 5 hours/week * 4 weeks/month * $100/hour = $2000
You can find the full estimate of cost here. Note that this does not include tuning and operational cost as it is not available in pricing export yet.
Once you have a good understanding of your AI costs, it is important to develop an optimization strategy that encompasses infrastructure choices, resource utilization, and monitoring practices to maintain performance while controlling expenses. By understanding the various cost components and leveraging Google Cloud’s tools and resources, you can confidently embark on your AI journey. Cost management isn’t a barrier; it’s an enabler. It allows you to experiment, innovate, and build transformative AI solutions in a financially responsible way.
Rosetta 2 is Apple’s translation technology for running x86-64 binaries on Apple Silicon (ARM64) macOS systems.
Rosetta 2 translation creates a cache of Ahead-Of-Time (AOT) files that can serve as valuable forensic artifacts.
Mandiant has observed sophisticated threat actors leveraging x86-64 compiled macOS malware, likely due to broader compatibility and relaxed execution policies compared to ARM64 binaries.
Analysis of AOT files, combined with FSEvents and Unified Logs (with a custom profile), can assist in investigating macOS intrusions.
Introduction
Rosetta 2 (internally known on macOS as OAH) was introduced in macOS 11 (Big Sur) in 2020 to enable binaries compiled for x86-64 architectures to run on Apple Silicon (ARM64) architectures. Rosetta 2 translates signed and unsigned x86-64 binaries just-in-time or ahead-of-time at the point of execution. Mandiant has identified several new highly sophisticated macOS malware variants over the past year, notably compiled for x86-64 architecture. Mandiant assessed that this choice of architecture was most likely due to increased chances of compatibility on victim systems and more relaxed execution policies. Notably, macOS enforces stricter code signing requirements for ARM64 binaries compared to x86-64 binaries running under Rosetta 2, making unsigned ARM64 binaries more difficult to execute. Despite this, in the newly identified APT malware families observed by Mandiant over the past year, all were self-signed, likely to avoid other compensating security controls in place on macOS.
The Rosetta 2 Cache
When a x86-64 binary is executed on a system with Rosetta 2 installed, the Rosetta 2 Daemon process (oahd) checks if an ahead-of-time (AOT) file already exists for the binary within the Rosetta 2 cache directory on the Data volume at /var/db/oah/<UUID>/. The UUID value in this file path appears to be randomly generated on install or update. If an AOT file does not exist, one will be created by writing translation code to a .in_progress file and then renaming it to a .aot file of the same name as the original binary. The Rosetta 2 Daemon process then runs the translated binary.
The /var/db/oah directory and its children are protected and owned by the OAH Daemon user account _oahd. Interaction with these files by other user accounts is only possible if System Integrity Protection (SIP) is disabled, which requires booting into recovery mode.
The directories under /var/db/oah/<UUID>/ are binary UUID values that correspond to translated binaries. Specifically, these binary UUID values are SHA-256 hashes generated from a combination of the binary file path, the Mach-O header, timestamps (created, modified, and changed), size, and ownership information. If the same binary is executed with any of these attributes changed, a new Rosetta AOT cache directory and file is created. While the content of the binaries is not part of this hashing function, changing the content of a file on an APFS file system will update the changed timestamp, which effectively means content changes can cause the creation of a new binary UUID and AOT file. Ultimately, the mechanism is designed to be extremely sensitive to any changes to x86-64 binaries at the byte and file system levels to reduce the risk of AOT poisoning.
Figure 1: Sample Rosetta 2 cache directory structure and contents
The Rosetta 2 cache binary UUID directories and the AOT files they contain appear to persist until macOS system updates. System updates have been found to cause the deletion of the cache directory (the Random UUID directory). After the upgrade, a directory with a different UUID value is created, and new Binary UUID directories and AOT files are created upon first launch of x86-64 binaries thereafter.
Translation and Universal Binaries
When universal binaries (containing both x86-64 and ARM64 code) are executed by a x86-64 process running through Rosetta 2 translation, the x86-64 version of these binaries is executed, resulting in the creation of AOT files.
Figure 2: Overview of execution of universal binaries with X864-64 processes translated through Rosetta 2 versus ARM64 processes
In a Democratic People’s Republic of Korea (DPRK) crypto heist investigation, Mandiant observed a x86-64 variant of the POOLRAT macOS backdoor being deployed and the attacker proceeding to execute universal system binaries including ping, chmod, sudo, id, and cat through the backdoor. This resulted in AOT files being created and provided evidence of attacker interaction on the system through the malware (Figure 5).
In some cases, the initial infection vector in macOS intrusions has involved legitimate x86-64 code that executes malware distributed as universal binaries. Because the initial x86-64 code runs under Rosetta 2, the x86-64 versions of malicious universal binaries are executed, leaving behind Rosetta 2 artifacts, including AOT files. In one case, a malicious Python 2 script led to the downloading and execution of a malicious universal binary. The Python 2 interpreter ran under Rosetta 2 since no ARM64 version was available, so the system executed the x86-64 version of the malicious universal binary, resulting in the creation of AOT files. Despite the attacker deleting the malicious binary later, we were able to analyze the AOT file to understand its functionality.
Unified Logs
The Rosetta 2 Daemon emits logs to the macOS Unified Log; however, the binary name values are marked as private. These values can be configured to be shown in the logs with a custom profile installed. Informational logs are recorded for AOT file lookups, when cached AOT files are available and utilized, and when translation occurs and completes. For binaries that are not configured to log to the Unified Log and are not launched interactively, in some cases this was found to be the only evidence of execution within the Unified Logs. Execution may be correlated with other supporting artifacts; however, this is not always possible.
0x21b1afc Info 0x0 1596 0 oahd: <private>(1880):
Aot lookup request for <private>
0x21b1afc Info 0x0 1596 0 oahd: <private>(1880):
Translating image <private> -> <private>
0x21b1afc Info 0x0 1596 0 oahd: <private>(1880):
Translation finished for <private>
0x21b1afc Info 0x0 1596 0 oahd: <private>(1880):
Aot lookup request for <private>
0x21b1afc Info 0x0 1596 0 oahd: <private>(1880):
Using cached aot <private> -> <private>
Figure 3: macOS Unified Logs showing Rosetta lookups, using cached files, and translating with private data disabled (default)
0x2ec304 Info 0x0 668 0 oahd: my_binary (Re(34180):
Aot lookup request for /Users/Mandiant/my_binary
0x2ec304 Info 0x0 668 0 oahd: my_binary (Re(34180):
Translating image /Users/Mandiant/my_binary ->
/var/db/oah/237823680d6bdb1e9663d60cca5851b63e79f6c
8e884ebacc5f285253c3826b8/1c65adbef01f45a7a07379621
b5800fc337fc9db90d8eb08baf84e5c533191d9/my_binary.in_progress
0x2ec304 Info 0x0 668 0 oahd: my_binary (Re(34180):
Translation finished for /Users/Mandiant/my_binary
0x2ec304 Info 0x0 668 0 oahd: my_binary(34180):
Aot lookup request for /Users/Mandiant/my_binary
0x2ec304 Info 0x0 668 0 oahd: my_binary(34180):
Using cached aot /Users/Mandiant/my_binary ->
/var/db/oah/237823680d6bdb1e9663d60cca5851b63e
79f6c8e884ebacc5f285253c3826b8/1c65adbef01f45a7
a07379621b5800fc337fc9db90d8eb08baf84e5c533191d9/my_binary.aot
Figure 4: macOS Unified Logs showing Rosetta lookups, using cached files, and translating with private data enabled (with custom profile installed)
FSEvents
FSEvents can be used to identify historical execution of x86-64 binaries even if Unified Logs or files in the Rosetta 2 Cache are not available or have been cleared. These records will show the creation of directories within the Rosetta 2 cache directory, the creation of .in_progress files, and then the renaming of the file to the AOT file, which will be named after the original binary.
Figure 5: Decoded FSEvents records showing the translation of a x86-64 POOLRAT variant on macOS, and subsequent universal system binaries executed by the malware as x86-64
AOT File Analysis
The AOT files within the Rosetta 2 cache can provide valuable insight into historical evidence of execution of x86-64 binaries. In multiple cases over the past year, Mandiant identified macOS systems being the initial entry vector by APT groups targeting cryptocurrency organizations. In the majority of these cases, Mandiant identified evidence of the attackers deleting the malware on these systems within a few minutes of a cryptocurrency heist being perpetrated. However, the AOT files were left in place, likely due to the protection by SIP and the relative obscurity of this forensic artifact.
From a forensic perspective, the creation and modification timestamps on these AOT files provide evidence of the first time a specified binary was executed on the system with a unique combination of the attributes used to generate the SHA-256 hash. These timestamps can be corroborated with other artifacts related to binary execution where available (for example, Unified Logs or ExecPolicy, XProtect, and TCC Databases), and file system activity through FSEvents records, to build a more complete picture of infection and possible attacker activity if child processes were executed.
Where multiple AOT files exist for the same origin binary under different Binary UUID directories in the Rosetta 2 cache, and the content (file hashes) of those AOT files is the same, this is typically indicative of a change in file data sections, or more commonly, file system metadata only.
Mandiant has previously shown that AOT files can be analyzed and used for malware identification through correlation of symbols. AOT files are Mach-O binaries that contain x86-64 instructions that have been translated from the original ARM64 code. They contain jump-backs into the original binary and contain no API calls to reference. Certain functionality can be determined through reverse engineering of AOT files; however, no static data, including network-based indicators or configuration data, are typically recoverable. In one macOS downloader observed in a notable DPRK cryptocurrency heist, Mandiant observed developer file path strings as part of the basic Mach-O information contained within the AOT file. The original binary was not recovered due to the attacker deleting it after the heist, so this provided useful data points to support threat actor attribution and malware family assessment.
Figure 6: Interesting strings from an AOT file related to a malicious DPRK downloader that was unrecoverable
In any case, determining malware functionality is more effective using the original complete binary instead of the AOT file, because the AOT file lacks much of the contextual information present in the original binary. This includes static data and complete Mach-O headers.
Poisoning AOT Files
Much has been written within the industry about the potential for the poisoning of the Rosetta 2 cache through modification or introduction of AOT files. Where SIP is disabled, this is a valid attack vector. Mandiant has not yet seen this technique in the wild; however, during hunting or investigation activities, it is advisable to be on the lookout for evidence of AOT poisoning. The best way to do this is by comparing the contents of the ARM64 AOT files with what would be expected based on the original x86-64 executable. This can be achieved by taking the original x86-64 executable and using it to generate a known-good AOT file, then comparing this to the AOT file in the cache. Discrepancies, particularly the presence of injected shellcode, could indicate AOT poisoning.
Conclusion
There are several forensic artifacts on macOS that may record historical evidence of binary execution. However, in cases of advanced intrusions with forensically aware attackers, original binaries being deleted, and no further security monitoring solutions, combining FSEvents, Unified Logs, and, crucially, residual AOT files on disk has provided the residual evidence of intrusion on a macOS system.
Whilst signed macOS ARM64 binaries may be the future, for now AOT files and the artifacts surrounding them should be reviewed in analysis of any suspected macOS intrusion and leveraged for hunting opportunities wherever possible.
The behavior identified in the cases presented here was identified on various versions of macOS between 13.5 and 14.7.2. Future or previous versions of macOS and Rosetta 2 may behave differently.
Acknowledgements
Special thanks to Matt Holley, Mohamed El-Banna, Robert Wallace, and Adrian Hernandez.
Welcome to the second Cloud CISO Perspectives for February 2025. Today, Christiane Peters from our Office of the CISO explains why post-quantum cryptography may seem like the future’s problem, but it will soon be ours if IT doesn’t move faster to prepare for it. Here’s what you need to know about how to get your post-quantum cryptography plans started.
As with all Cloud CISO Perspectives, the contents of this newsletter are posted to the Google Cloud blog. If you’re reading this on the website and you’d like to receive the email version, you can subscribe here.
–Phil Venables, VP, TI Security & CISO, Google Cloud
aside_block
<ListValue: [StructValue([(‘title’, ‘Get vital board insights with Google Cloud’), (‘body’, <wagtail.rich_text.RichText object at 0x3e42d4260ee0>), (‘btn_text’, ‘Visit the hub’), (‘href’, ‘https://cloud.google.com/solutions/security/board-of-directors?utm_source=cloud_sfdc&utm_medium=email&utm_campaign=FY24-Q2-global-PROD941-physicalevent-er-CEG_Boardroom_Summit&utm_content=-&utm_term=-‘), (‘image’, <GAEImage: GCAT-replacement-logo-A>)])]>
Prepare early for PQC to be resilient against tomorrow’s cryptographic threats
By Christiane Peters, security architect, Office of the CISO, Google Cloud
Post-quantum cryptography adoption is rapidly becoming a reality, and the need for active deployment and implementation is becoming increasingly urgent — sooner than you might think.
Christiane Peters, security architect, Office of the CISO, Google Cloud
We know that eventually, perhaps sooner than expected, cryptographically-relevant quantum computers (CRQC) will be able to break some of the critical cryptography that underpins today’s cybersecurity infrastructure. There are two CRQC risks we can prepare for now (with an in-depth analysis available here):
Harvest Now, Decrypt Later attacks, where a threat actor steals encrypted data that they anticipate decrypting by an as-yet unbuilt CRQC in the future.
Threat actors could use a CRQC to forge digital signatures and implant them in compromised firmware or software updates.
However, unless you have national security data, immensely valuable long-term intellectual property, long-term sensitive communications, or a cryptographic architecture where small numbers of keys can unlock all previously encrypted data, then neither of the above is quite as serious a risk as some people would have you think.
The more significant risk for most business leaders and organizations is that implementing post-quantum cryptography (PQC) will take a long time, as Phil Venables’ noted in a recent blog on how executives should take a tactical approach to implementing PQC.
PQC is the industry effort to defend against those risks — a bit like the Y2K movement, but scaled for the 21st century. PQC is defining the cryptographic standards and implementing newly-designed algorithms that are expected to be resistant to attacks by both classical and quantum computers.
Business leaders should be taking a closer look at PQC, and be discussing how to implement it with their security teams. Preparing PQC can help you reduce the risks you’ll face in the future, and make them more resilient to the challenges of evolving technology.
While a decade in the future may seem very far away, the reality is that the work needed will take that long to prepare — and waiting might mean you are already too late.
Many organizations are working on post-quantum cryptography, including the U.S. National Institute of Standards and Technology. NIST published quantum-safe cryptographic standards last summer, and in November suggested a transition timeline to retire some of today’s public-key cryptosystems by 2030, and no later than 2035.
Together, these efforts have begun enabling technology vendors to take steps toward PQC migrations. Crucially, all of NIST’s PQC standards run on the classical computers we currently use.
NIST’s new standards are an important step in the right direction, but PQC migration won’t happen even in 12 months. While a decade in the future may seem very far away, the reality is that the work needed will take that long to prepare — and waiting might mean you are already too late. There are four key steps you can take today to prepare for post-quantum cryptography.
Develop a plan: CISOs, CIOs, and CTOs should craft a roadmap for implementing quantum-resistant cryptography. This plan should balance cost, risk, and usability, while ensuring the new algorithms are integrated into existing systems.
Identify and protect: Assess the data and systems most at risk from quantum threats, including all systems using asymmetric encryption and key exchange, systems using digital signatures such as PKI, software and firmware signatures, and authentication mechanisms. Refer back to Google’s quantum threat analysis to help determine which changes should be addressed first.
Anticipate system-wide effects: Analyze the broader risk that a PQC migration could pose to other systems. This could be similar to the Y2K problem where the format of data (for example, larger digital signatures) in databases and applications might need significant software changes beyond the cryptography.
Learn from experience: Reflect on how your organisation has tackled previous cryptography-related challenges, such as the Heartbleed vulnerability in TLS and retiring SHA1. Build an understanding of what worked well and what improvements were needed to help guide your approach to PQC adoption. Conducting a tabletop exercise with leadership teams can help identify potential challenges early by simulating the migration of cryptographic systems.
Given that we don’t know exactly how far off a cryptographically-relevant quantum computer is, and that we’re facing associated risks today, experience tells us that in the wrong hands quantum computing could be used to compromise the privacy and security of digital communications across industries and borders. Taking action early can help ensure a smooth transition to quantum-resistant cryptography and stay ahead of evolving expectations.
<ListValue: [StructValue([(‘title’, ‘Join the Google Cloud CISO Community’), (‘body’, <wagtail.rich_text.RichText object at 0x3e42d4260a60>), (‘btn_text’, ‘Learn more’), (‘href’, ‘https://rsvp.withgoogle.com/events/ciso-community-interest?utm_source=cgc-blog&utm_medium=blog&utm_campaign=2024-cloud-ciso-newsletter-events-ref&utm_content=-&utm_term=-‘), (‘image’, <GAEImage: GCAT-replacement-logo-A>)])]>
In case you missed it
Here are the latest updates, products, services, and resources from our security teams so far this month:
Get ready for a unique, immersive security experience at Next ‘25: Here’s why Google Cloud Next is shaping up to be a must-attend event for security experts and the security-curious alike. Read more.
Next ‘25 can help elevate your cybersecurity skills. Here’s how: From red teaming to tabletop exercises to the SOC Arena, Next ’25 has something for security pros and newcomers alike. Read more.
How Google uses threat intelligence to uncover and track cybercrime: Google Threat Intelligence Group’s Kimberly Goody takes you behind the scenes and explains threat intelligence helps us find and monitor cybercriminals. Read more.
5 key cybersecurity strategies for manufacturing executives: Here are five key governance strategies that can help manufacturing executives build a robust cybersecurity posture and better mitigate the evolving risks they face. Read more.
Announcing quantum-safe digital signatures in Cloud KMS: We’re introducing quantum-safe digital signatures in Cloud KMS, and we’re sharing more on our PQC strategy for Google Cloud encryption products. Read more.
Collaborate without compromise: Introducing Isolator open source: Isolator is a purpose-built, secure collaboration tool that can enable organizations to work with sensitive data in a controlled environment in Google Cloud. It can help solve the problem of giving collaborators access to restricted data and tools when building solutions that involve sensitive information. Read more.
Please visit the Google Cloud blog for more security stories published this month.
aside_block
<ListValue: [StructValue([(‘title’, ‘Fact of the month’), (‘body’, <wagtail.rich_text.RichText object at 0x3e42d4260e50>), (‘btn_text’, ‘Learn more in our new cybercrime report’), (‘href’, ‘https://cloud.google.com/blog/topics/threat-intelligence/cybercrime-multifaceted-national-security-threat/’), (‘image’, <GAEImage: GCAT-replacement-logo-A>)])]>
Threat Intelligence news
Multiple Russia-aligned threat actors targeting Signal: Google Threat Intelligence Group has observed increasing efforts from several Russia state-aligned threat actors to compromise Signal Messenger accounts used by individuals of interest to Russia’s intelligence services. Read more.
Phishing campaigns targeting higher-education institutions: Google’s Workspace Trust and Safety team and Mandiant have observed a notable increase in phishing attacks targeting the education industry, specifically U.S.-based universities, as well as a long-term campaign, targeting thousands of educational institution users each month. Read more.
Please visit the Google Cloud blog for more threat intelligence stories published this month.
Now hear this: Google Cloud Security and Mandiant podcasts
Metrics, challenges, and SecOps hot takes from a modern bank CISO: Dave Hannigan, CISO, Nubank, discusses the ups, downs, and surprises that only CISOs at a cutting-edge financial institution can face, with hosts Anton Chuvakin and Tim Peacock. Listen here.
Using threat intelligence to decode the underground: Kimberly Goody, cybercrime analysis lead, Google Threat Intelligence Group, takes behind-the-scenes look with Anton and Tim at how GTIG attributes cyberattacks with high confidence, the difficulty of correlating publicly-known tool names with threat actors’ aliases, and how GTIG does threat intelligence differently. Listen here.
Defender’s Advantage: Signals of trouble: Dan Black, principal analyst, GTIG, joins host Luke McNamara to discuss the research into Russia-aligned threat actors seeking to compromise Signal Messenger. Listen here.
To have our Cloud CISO Perspectives post delivered twice a month to your inbox, sign up for our newsletter. We’ll be back in February with more security-related updates from Google Cloud.
It’s a persistent question: How do you know which generative AI model is the best choice for your needs? It all comes down to smart evaluation.
In this post, we’ll share how to perform pairwise model evaluations – a way of comparing two models directly against each other – using Vertex AI evaluation service and LLM Comparator. We’ll introduce each tool’s useful features, why the tools help us evaluate performance of LLMs, and how you can use it to create a robust evaluation framework.
Pairwise model evaluation to assess performance
Pairwise model evaluation means comparing two models directly against each other to assess their relative performance on a specific task. There are three main benefits to pairwise model evaluation for LLMs:
Make informed decisions: The increasing number and variety of LLMs means you need to carefully evaluate and choose the best model for your specific task. Considering the strengths and weaknesses of each option is table stakes.
Define “better” quantitatively: Generated content from generative AI models, such as natural language texts or images, are usually unstructured, lengthy, and difficult to evaluate automatically without human intervention. Pairwise helps define ”better” response close to human responses to each prompt with human inspection.
Keep an eye out: LLMs should be continuously retrained and tuned with the new data to be enhanced compared with the previous versions of them and other latest models.
The proposed evaluation process for LLMs.
Vertex AI evaluation service
The Gen AI evaluation service in Vertex AI lets you evaluate any generative model or application and benchmark the evaluation results against your own judgment, using your own evaluation criteria. It helps with:
Model selection among different models for specific use cases
Model configuration optimization with different model parameters
Prompt engineering for the preferred behavior and responses
Fine-tuning LLMs for improved accuracy, fairness, and safety
Optimizing RAG architectures
Migration between different versions of a model
Managing translation qualities between different languages
<ListValue: [StructValue([(‘title’, ‘$300 in free credit to try Google Cloud AI and ML’), (‘body’, <wagtail.rich_text.RichText object at 0x3e42d3fe6ee0>), (‘btn_text’, ‘Start building for free’), (‘href’, ‘http://console.cloud.google.com/freetrial?redirectPath=/vertex-ai/’), (‘image’, None)])]>
How to use Vertex AI evaluation service
The Vertex AI evaluation service can help you rigorously assess your generative AI models. You can define custom metrics, leveraging pre-built templates or your own expertise, to precisely measure performance against your specific goals. For standard NLP tasks, the service provides computation-based metrics like F1 scores for classification, BLEU for translation, and ROUGE-L for summarization.
For direct model comparison, pairwise evaluations allow you to quantify which model performs better. Metrics like candidate_model_win_rate and baseline_model_win_rate are automatically calculated, and judge models provide explanations for their scoring decisions, offering valuable insights. You can also perform pairwise comparisons using computation based metrics to compare against the ground truth data.
Beyond pre-built metrics, you have the flexibility to define your own, either through mathematical formulas or by using prompts to help “judge models” aligned with the context of the user-defined metrics. Embedding-based metrics are also available for evaluating semantic similarity.
Vertex AI Experiments and Metadata seamlessly integrate with the evaluation service, automatically organizing and tracking your datasets, results, and models. You can easily initiate evaluation jobs using the REST API or Python SDK and export results to Cloud Storage for further analysis and visualization.
In essence, the Vertex AI evaluation service provides a comprehensive framework for:
Quantifying model performance: Using both standard and custom metrics.
Comparing models directly: Through pairwise evaluations and judge model insights.
Customizing evaluations: To meet your specific needs.
Streamlining your workflow: With integrated tracking and easy API access.
It also provides guidance and templates to help you define your own metrics referring to those templates or from scratch with your experiences of prompt engineering and generative AI.
LLM Comparator: An open-source tool for human-in-the-loop LLM evaluation
LLM Comparator is an evaluation tool developed by PAIR (People + AI Research; PAIR) at Google, and is an active research project.
LLM Comparator’s interface is highly intuitive for side-by-side comparisons of different model outputs, making it an excellent tool to augment automated LLM evaluation with human-in-the-loop processes. The tool provides useful features to help you evaluate the responses from two LLMs side-by-side using a range of informative metrics, such as the win rates of Model A or B, grouped by prompt category. It is also simple to extend the tool with user-defined metrics, via a feature called Custom Functions.
The dashboards and visualizations of LLM Comparator by PAIR of Google.
You can see the comparative performance of Model A and Model B across various metrics and prompt categories through ‘Score Distribution’ and ‘Metrics by Prompt Category’ visualizations. In addition, the ‘Rationale Summary visualization provides insights into why one model outperforms another by visually summarizing the key rationales influencing the evaluation results.
The “Rationale Summary” panel visually explains why one model’s responses are determined to be better.
LLM Comparator is available as a Python package on PyPI, and can be installed on a local environment. Pairwise evaluation results from the Vertex AI Evaluation Service can also be loaded into LLM Comparator using provided libraries. To learn more about how you can transform the automated evaluation results to JSON files, please refer to the JSON data format and schema for LLM Comparator.
With features such as the Rationale Cluster visualization and Custom Functions, LLM Comparator can serve as an invaluable tool in the final stages of LLM evaluation where human-in-the-loop processes are needed to ensure overall quality.
Feedback from the field: How LLM Comparator adds value to Vertex AI evaluation service
By augmenting human evaluators with ready-to-use convenient visualizations and performance metrics calculated automatically, LLM Comparator reduces many chores of ML engineers to develop their own visualizations and quality monitoring tools. Thanks to the JSON data format and schema of LLM Comparator, Vertex AI evaluation service and LLM Comparator can be integrated conveniently without any serious amount of development work.
We’ve heard from our teams that the most useful feature of LLM Comparator is the visualization of “Rationale Summary”. “Rationale Summary” can be thought of as a kind of explainable AI (XAI) tool which is very useful to learn why a specific model among the two is better in the judge model’s view. Another important aspect of “Rationale Summary” visualization is that it can be used to understand how a specific language model is working differently from the other model, which is sometimes a very important support to infer why the model is more appropriate for specific tasks.
A limitation of LLM Comparator is that it can be used just for pair-wise model evaluation, not for simultaneous multiple model evaluation. However, LLM Comparator already has basic components for comparative LLM evaluations and extending it to simultaneous multiple model evaluation may not be a big technical problem. This can be an excellent project for you to contribute to the LLM Comparator project.
Conclusion
In this article, we learned and discussed how we can organize the evaluation process of LLMs with Vertex AI and LLM Comparator, an open source LLM evaluation tool by PAIR. By combining Vertex AI Evaluation Service and LLM Comparator, we’ve presented a semi-automated approach to systematically evaluate and compare the performance of diverse LLMs on Google Cloud. Get started with Vertex AI Evaluation Service today.
We thank Rajesh Thallam, Skander Hannachi, and the Applied AI Engineering team for help with this blog post and guidance on overall best practices. We also thank Anant Nawalgaria for help with this blog post and technical guidance.