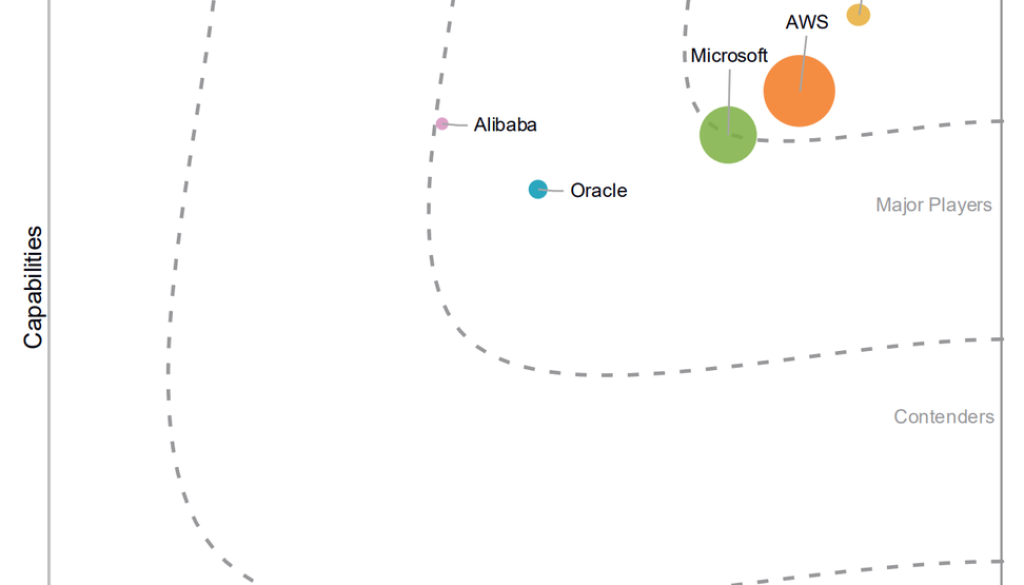
GCP – Google is a Leader in the 2025 IDC MarketScape: FinOps Cloud Costs Optimization
Our customers come first, and we’ve focused on building FinOps tools that help them understand their cloud spend, optimize for efficiency, and prevent cost surprises. We’re excited to be recognized for this work, and named a leader in the 2025 IDC MarketScape for FinOps cloud cost optimization.

“This study evaluated the five global hyperscalers and their FinOps cloud cost optimization capabilities, assessing several dimensions within strategy and product capabilities. A strength of Google Cloud FinOps is its integration with Gemini, helping customers mature, automate, and accelerate cost optimization. This is in addition to the thought leadership Google has been demonstrating with its product strategy and driving industry support for open standards.” – Jevin Jensen, IDC Research Vice President and triple-certified FinOps practitioner and engineer
Here are the top 10 of our top FinOps innovations that are helping Google Cloud FinOps tools:
- We stream net-cost data in real time, so your information stays current with actual cloud costs. 99% of that data arrives within 24 hours, and many services update several times a day.
- We provide granular, sub-resource cost data out-of-the-box – without additional hoops to jump through, like agent installs – which means you can understand your cost drivers faster. For example, for more than two years, we have broken up Kubernetes costs into clusters, namespaces, and pods.
- The FinOps Hub centralizes all cost optimization activities in one place, highlighting inefficiencies so business professionals can collaborate with development teams to drive meaningful change.
FinOps Hub in action
4. We integrated generative AI into FinOps workflows early, creating specialized business use cases for all users. This saves time when finding cost insights and optimization opportunities, with grounded answers to ensure accuracy and relevance.
Gemini Cloud Assist for FinOps in action.
5. We focus on the FinOps user, and the rest follows. Over the years, we have built up an amazing group of FinOps practitioners we work closely with to evolve our FinOps products. We also have a FinOps executive advisory board that allows us to look forward and understand where the industry is evolving.
6. We believe we can make billing enjoyable. The microinteractions, zero states, guided tours, and elegant material design, all work together to create experiences that feel intuitive and Googley.
7. We provide customers a FinOps score to help you make data-informed decisions when building business cases for committed use discounts or identifying spend that needs better organization through tagging or budget coverage. Using this score you can see how you benchmark against peers.
Google Cloud customers get their own FinOps score and can see how they compare with their peers.
8. We have fast cost-anomaly detection that runs hourly, with high precision. And we also offer root cause analysis information for our users to take action quickly.
9. We provide real-time scenario modelling for rate optimizations, managing terabytes of data in our UI quickly and easily. Customer controls let you shape and model the data as needed.
FinOps Hub scenario modelling in action.
10. We provide these FinOps tools at no additional charge to Google Cloud customers. We don’t charge extra for extended data lookback windows, UI views and analysis, or FinOps Hub cost optimizations. This helps customers spend less time on understanding their bills and more time driving business innovation.
Read the full IDC MarketScape excerpt to learn more about our capabilities.
Source: “IDC MarketScape: Worldwide FinOps Cloud Costs Optimization Hyperscalers 2025 Vendor Assessment” by Jevin Jensen, July 2025, IDC #US53679825
IDC MarketScape vendor analysis model is designed to provide an overview of the competitive fitness of ICT suppliers in a given market. The research methodology utilizes a rigorous scoring methodology based on both qualitative and quantitative criteria that results in a single graphical illustration of each vendor’s position within a given market. The Capabilities score measures vendor product, go-to-market and business execution in the short-term. The Strategy score measures alignment of vendor strategies with customer requirements in a 3-5-year timeframe. Vendor market share is represented by the size of the circles. Vendor year-over-year growth rate relative to the given market is indicated by a plus, neutral or minus next to the vendor name.
Read More for the details.


