GCP – Understand how your users are using Gemini for Google Cloud with Cloud Logging and Monitoring
From helping your developers write better code faster with Code Assist, to helping cloud operators more efficiently manage usage with Cloud Assist, Gemini for Google Cloud is your personal AI-powered assistant.
However, understanding exactly how your internal users are using Gemini has been a challenge — until today.
Today we are announcing that Cloud Logging and Cloud Monitoring support for Gemini for Google Cloud. Currently in public preview, Cloud Logging records requests and responses between Gemini for Google Cloud and individual users, while Cloud Monitoring reports 1-day, 7-day, and 28-day Gemini for Google Cloud active users and response counts in aggregate.
- aside_block
- <ListValue: [StructValue([(‘title’, ‘Try Google Cloud for free’), (‘body’, <wagtail.rich_text.RichText object at 0x3e6158f2a4c0>), (‘btn_text’, ‘Get started for free’), (‘href’, ‘https://console.cloud.google.com/freetrial?redirectPath=/welcome’), (‘image’, None)])]>
Cloud Logging
In addition to offering customers general visibility into the impact of Gemini, there are a few scenarios where logs are useful:
-
to track the provenance of your AI-generated content
-
to record and review user usage of Gemini for Google Cloud
This feature is available as opt-in and when enabled, logs your users’ Gemini for Google Cloud activity to Cloud Logging (Cloud Logging charges apply).
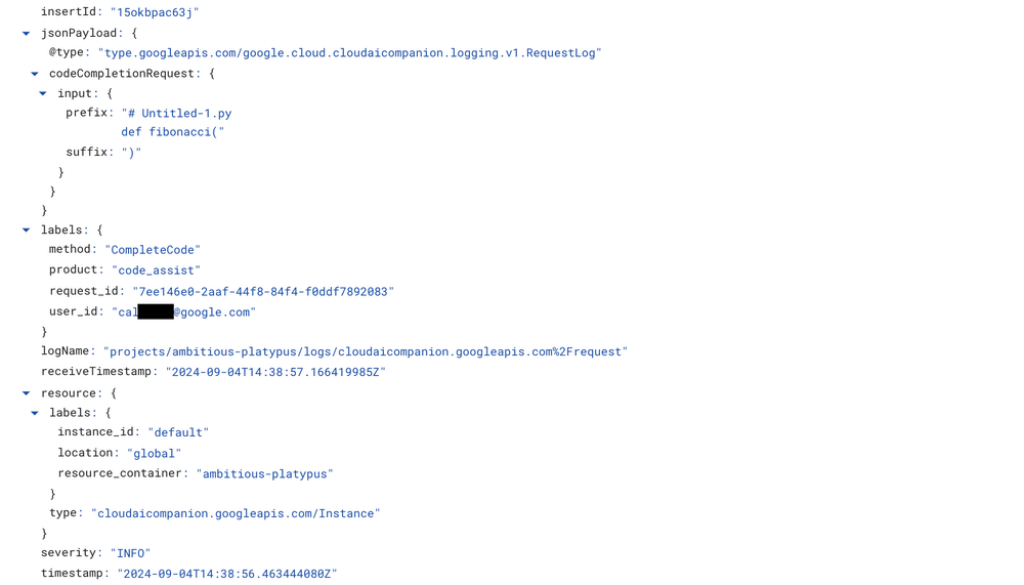
Once enabled, log entries are made for each request to and response from Gemini for Google Cloud. In a typical request entry, Logs Explorer would provide an entry similar to the following example:

There are several things to note about this entry:
-
The content inside
jsonPayloadcontains information about the request. In this case, it was a request to complete Python code withdef fibonaccias the input. -
The labels tell you the method (
CompleteCode), the product (code_assist), and the user who initiated the request (cal@google.com). -
The resource labels tell you the instance, location, and resource container (typically project) where the request occurred.
In a typical response entry, you’ll see the following:

Note that the request_id inside the label are identical for this pair of requests and responses, enabling identification of request and response pairs.
In addition to the Log Explorer, Log Analytics supports queries to analyze your log data, and help you answer questions like “How many requests did User XYZ make to Code Assist?”
For more details, please see the Gemini for Google Cloud logging documentation.
Cloud Monitoring
Gemini for Google Cloud monitoring metrics help you answer questions like:
-
How many unique active users used Gemini for Google Cloud services over the past day or seven days?
-
How many total responses did my users receive from Gemini for Google Cloud services over the past six hours?
Cloud Monitoring support for Gemini for Google Cloud is available to anybody who uses a Gemini for Google Cloud product and records responses and active users as Cloud Monitoring metrics, with which dashboards and alerts can be configured.
Because these metrics are available with Cloud Monitoring, you can also use them as part of Cloud Monitoring dashboards. A “Gemini for Google Cloud” dashboard is automatically installed under “GCP Dashboards” when Gemini for Google Cloud usage is detected:
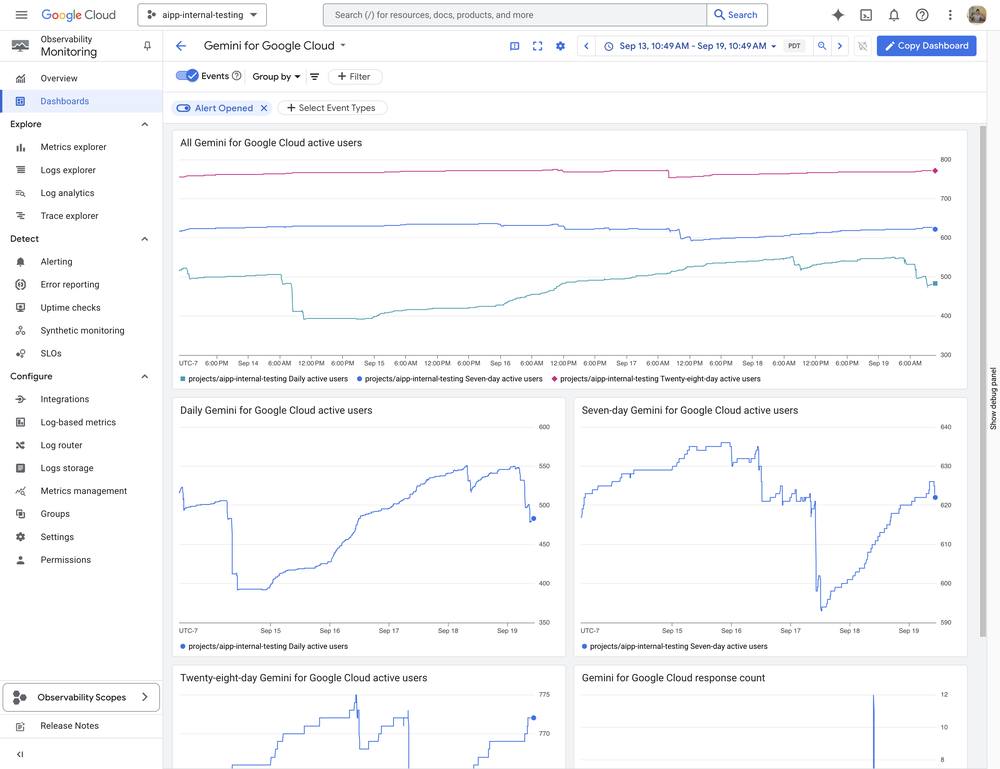
Metrics Explorer offers another avenue where metrics can be examined and filters applied to gain a more detailed view of your usage. This is done by selecting the “Cloud AI Companion Instance” active resource in the Metrics Explorer:

In the example above, response_count is the number of responses sent by Gemini for Google Cloud, and can be filtered for Gemini Code Assist or the Gemini for Google Cloud method (code completion/generation).
For more details, please see the Gemini for Google Cloud monitoring documentation.
What’s next
We’re continually working on additions to these new capabilities, and in particular are focused on Code Assist logging and metrics enhancements that will bring even further insight and observability into your use of Gemini Code Assist and its impact. To get started with Gemini Code Assist and learn more about Gemini Cloud Assist — as well as observability data about it from Cloud Logging and Monitoring — check out the following links:
Read More for the details.
