GCP – Dataproc Serverless: Now faster, easier and smarter
We are thrilled to announce new capabilities that make running Dataproc Serverless even faster, easier, and more intelligent.
Elevate your Spark experience with:
- Native query execution: Experience significant performance gains with the new Native query execution in the Premium tier.
- Seamless monitoring with Spark UI: Track job progress in real time with a built-in Spark UI available by default for all Spark batches and sessions.
- Streamlined investigation: Troubleshoot batch jobs from a central “Investigate” tab displaying all the essential metrics highlights and logs filtered by errors automatically.
- Proactive autotuning and assisted troubleshooting with Gemini: Let Gemini minimize failures and autotune performance based on historical patterns. Quickly resolve issues using Gemini-powered insights and recommendations.
- aside_block
- <ListValue: [StructValue([(‘title’, ‘$300 in free credit to try Google Cloud data analytics’), (‘body’, <wagtail.rich_text.RichText object at 0x3e461910aaf0>), (‘btn_text’, ‘Start building for free’), (‘href’, ‘http://console.cloud.google.com/freetrial?redirectPath=/bigquery/’), (‘image’, None)])]>
Accelerate your Spark jobs with native query execution
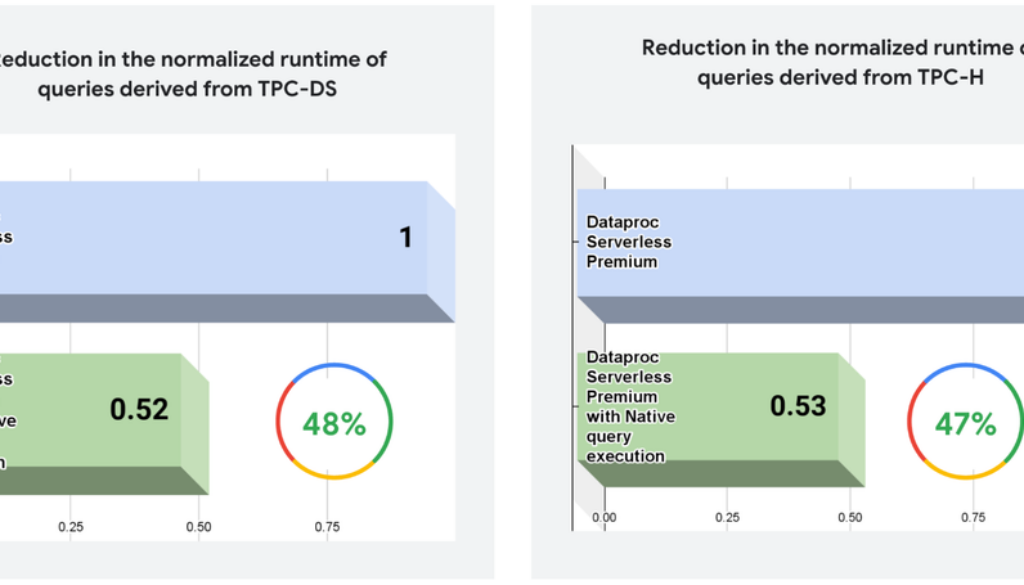
You can unlock considerable speed improvements for your Spark batch jobs in the Premium tier on Dataproc Serverless Runtimes 2.2.26+ or 1.2.26+ by enabling native query execution — no application changes required.
This new feature in Dataproc Serverless Premium tier improved the query performance by ~47%in our tests on queries derived from TPC-DS and TPC-H benchmarks.
Note: Performance results are based on 1TB GCS Parquet data and queries derived from the TPC-DS standard and TPC-H standard. These runs as such aren’t comparable to published TPC-DS standard and TPC-H standard results, as these runs don’t comply with all requirements of the TPC-DS standard and and TPC-H standard specification.
Start now by running the native query execution qualification tool that can help you easily identify eligible jobs and estimate potential performance gains. Once you have the list of batch jobs identified for native query execution, you can enable it and have the jobs run faster and potentially save costs.
Seamless monitoring with Spark UI
Tired of wrestling with setting up the persistent history server (PHS) clusters and maintaining them just to debug your Spark batches? Wouldn’t it be easier if you could avoid the ongoing costs of the history server and yet see the Spark UI in real-time?
Until now, monitoring and troubleshooting Spark jobs in Dataproc Serverless required setting up and managing a separate Spark persistent history server. Crucially, each batch job had to be configured to use the history server. Otherwise, the open-source UI would be unavailable for analysis for the batch job. Additionally, the open-source UI suffered from slow navigation between applications.
We’ve heard you, loud and clear. We’re excited to announce a fully managed Spark UI in Dataproc Serverless that makes monitoring and troubleshooting a breeze.
The new Spark UI is built-in and automatically available for every batch job and session in both Standard and Premium tiers of Dataproc Serverless at no additional cost. Simply submit your job and start analyzing performance in real time with the Spark UI right away.
Here’s why you’ll love the Serverless Spark UI:
|
Traditional Approach |
The new Dataproc Serverless Spark UI |
|
|
Effort |
Create and manage a Spark history server cluster. Configure each batch job to use the cluster. |
No cluster setup or management required. Spark UI is available by default for all your batches without any extra configuration.The UI can be accessed directly from the Batch / Session details page in the Google Cloud console. |
|
Latency |
UI performance can degrade with increased load. Requires active resource management. |
Enjoy a responsive UI that automatically scales to handle even the most demanding workloads. |
|
Availability |
The UI is only available as long as the history server cluster is running. |
Access your Spark UI for 90 days after your batch job is submitted. |
|
Data freshness |
Wait for a stage to complete to see that its events are in the UI. |
View regularly updated data without waiting for the stage to complete. |
|
Functionality |
Basic UI based on open-source Spark. |
Enhanced UI with ongoing improvements based on user feedback. |
|
Cost |
Ongoing cost for the PHS cluster. |
No additional charge. |
Accessing the Spark UI
To gain deeper insights into your Spark batches and sessions — whether they’re still running or completed — simply navigate to the Batch Details or Session Details page in the Google Cloud console. You’ll find a “VIEW SPARK UI” link in the top right corner.

The new Spark UI provides the same powerful features as the open-source Spark History Server, giving you deep insights into your Spark job performance. Easily browse both running and completed applications, explore jobs, stages, and tasks, and analyze SQL queries for a comprehensive understanding of the execution of your application. Quickly identify bottlenecks and troubleshoot issues with detailed execution information. For even deeper analysis, the ‘Executors’ tab provides direct links to the relevant logs in Cloud Logging, allowing you to quickly investigate issues related to specific executors.
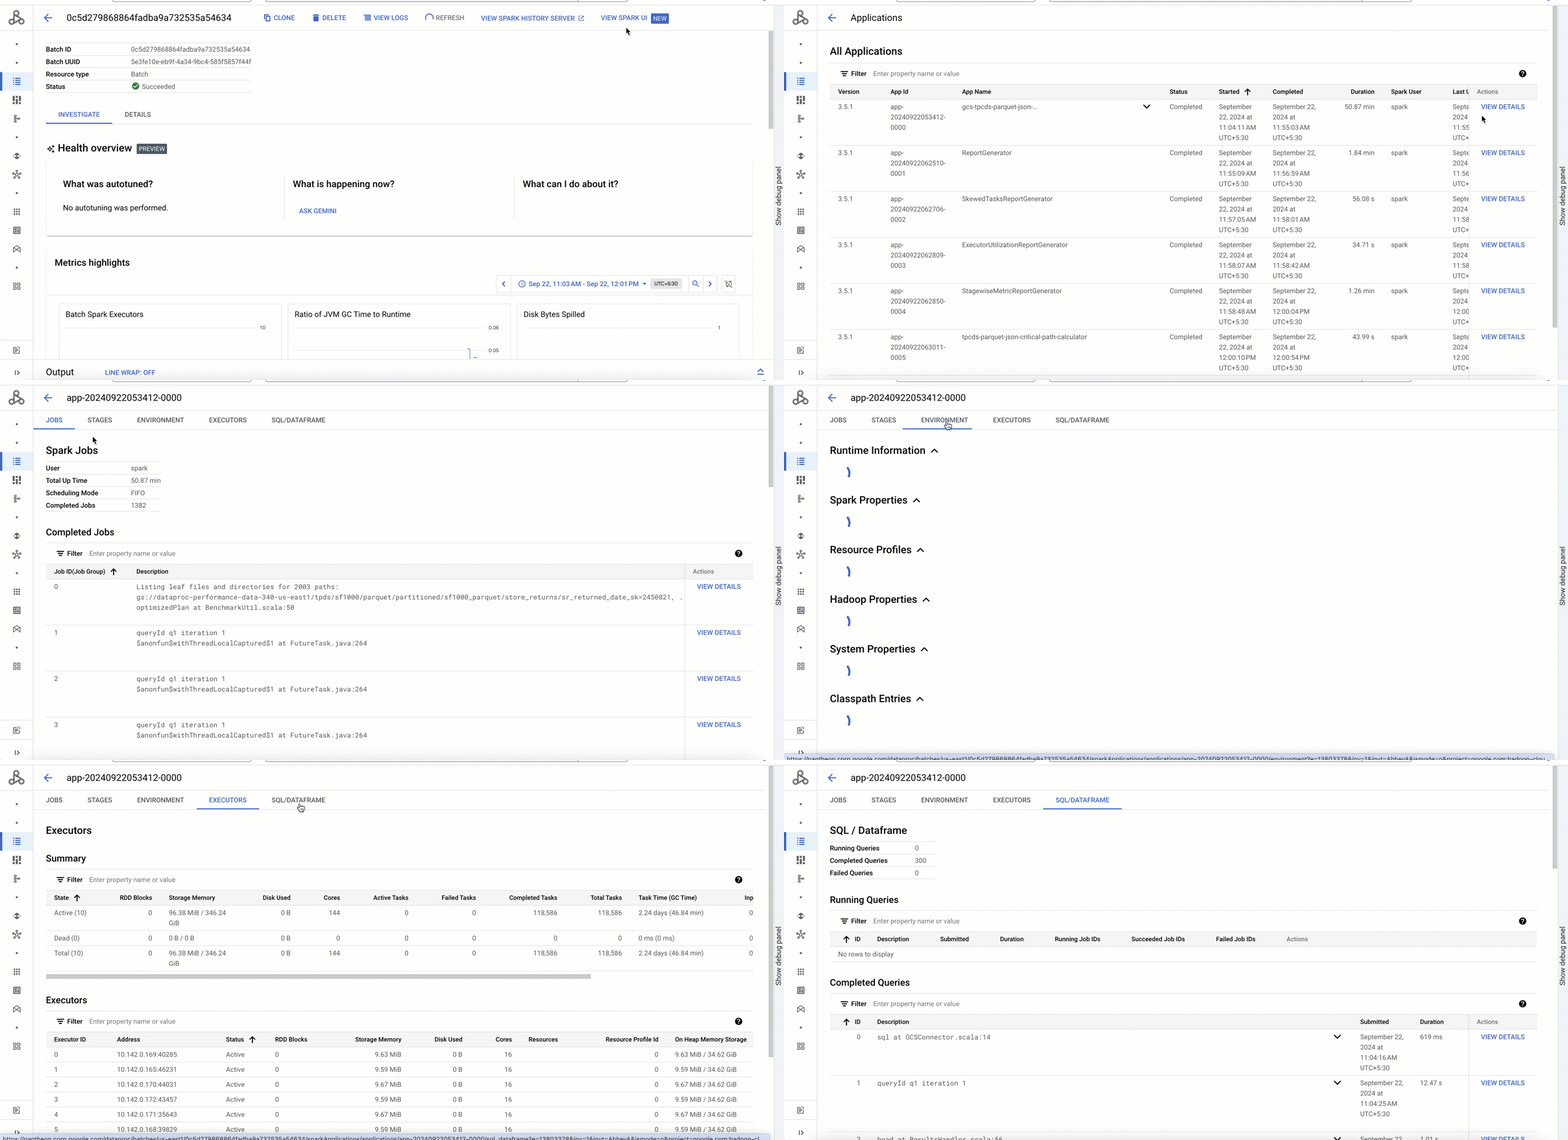
You can still use the “VIEW SPARK HISTORY SERVER” link to view the Persistent Spark History Server if you had already configured one.
Explore this feature now. Click “VIEW SPARK UI” on the top right corner of the Batch details page of any of your recent Spark batch jobs to get started. Learn more in the Dataproc Serverless user guide.
Streamlined investigation (Preview)
A new “Investigate” tab in the Batch details screen gives you instant diagnostic highlights collected at a single place.
In the “Metrics highlights” section, the essential metrics are automatically displayed, giving you a clear picture of your batch job’s health. You can further create a custom dashboard if you need more metrics.

Below the metrics highlights, a widget “Job Logs” shows the logs filtered by errors, so you can instantly spot and address problems. If you would like to dig further into the logs, you can go to the Logs Explorer.

Proactive autotuning and assisted troubleshooting with Gemini (Preview)
Last but not least, Gemini in BigQuery can help reduce the complexity of optimizing hundreds of Spark properties in your batch job configurations while submitting the job. If the job fails or runs slow, Gemini can save the effort of wading through several GBs of logs to troubleshoot the job.
Optimize performance: Gemini can automatically fine-tune the Spark configurations of your Dataproc Serverless batch jobs for optimal performance and reliability.

Simplify troubleshooting: You can quickly diagnose and resolve issues with slow or failed jobs by clicking “Ask Gemini” for AI-powered analysis and guidance.


Sign up here for a free preview of the Gemini features and “Investigate” tab for Dataproc Serverless.
Read More for the details.
