GCP – In-context observability with customizable dashboards everywhere on Google Cloud
Unified observability and quick troubleshooting are vital for any application and system running in the cloud, including popular Google Cloud products. At the same time, different companies and development teams have different needs, and a one-size-fits-all observability dashboard often falls short. Over the past year, dozens of Google Cloud teams have added deep-dive observability dashboards for compute runtimes, databases, storage, and more; today, we’re excited to announce customizable observability dashboards in more than 10 Google Cloud services.
Now, you can tailor and customize dashboards to your unique needs in the context of the services — including popular requests like adding and removing charts, adding raw logs, changing the configuration of charts, creating alerts and more, at no additional cost.
The toolset brings the full dashboarding experience previously available only in the Cloud Monitoring UI directly into the UI of the relevant Google Cloud product or service. You no longer need to hop between different observability solutions to get the signals you need for troubleshooting and remediation.
Customizable observability dashboards are now available in Google Kubernetes Engine (GKE), Compute Engine, Cloud Run, Cloud Functions, Cloud Storage, Dataproc, Dataflow, MySQL System Insights, and many other Google Cloud services.
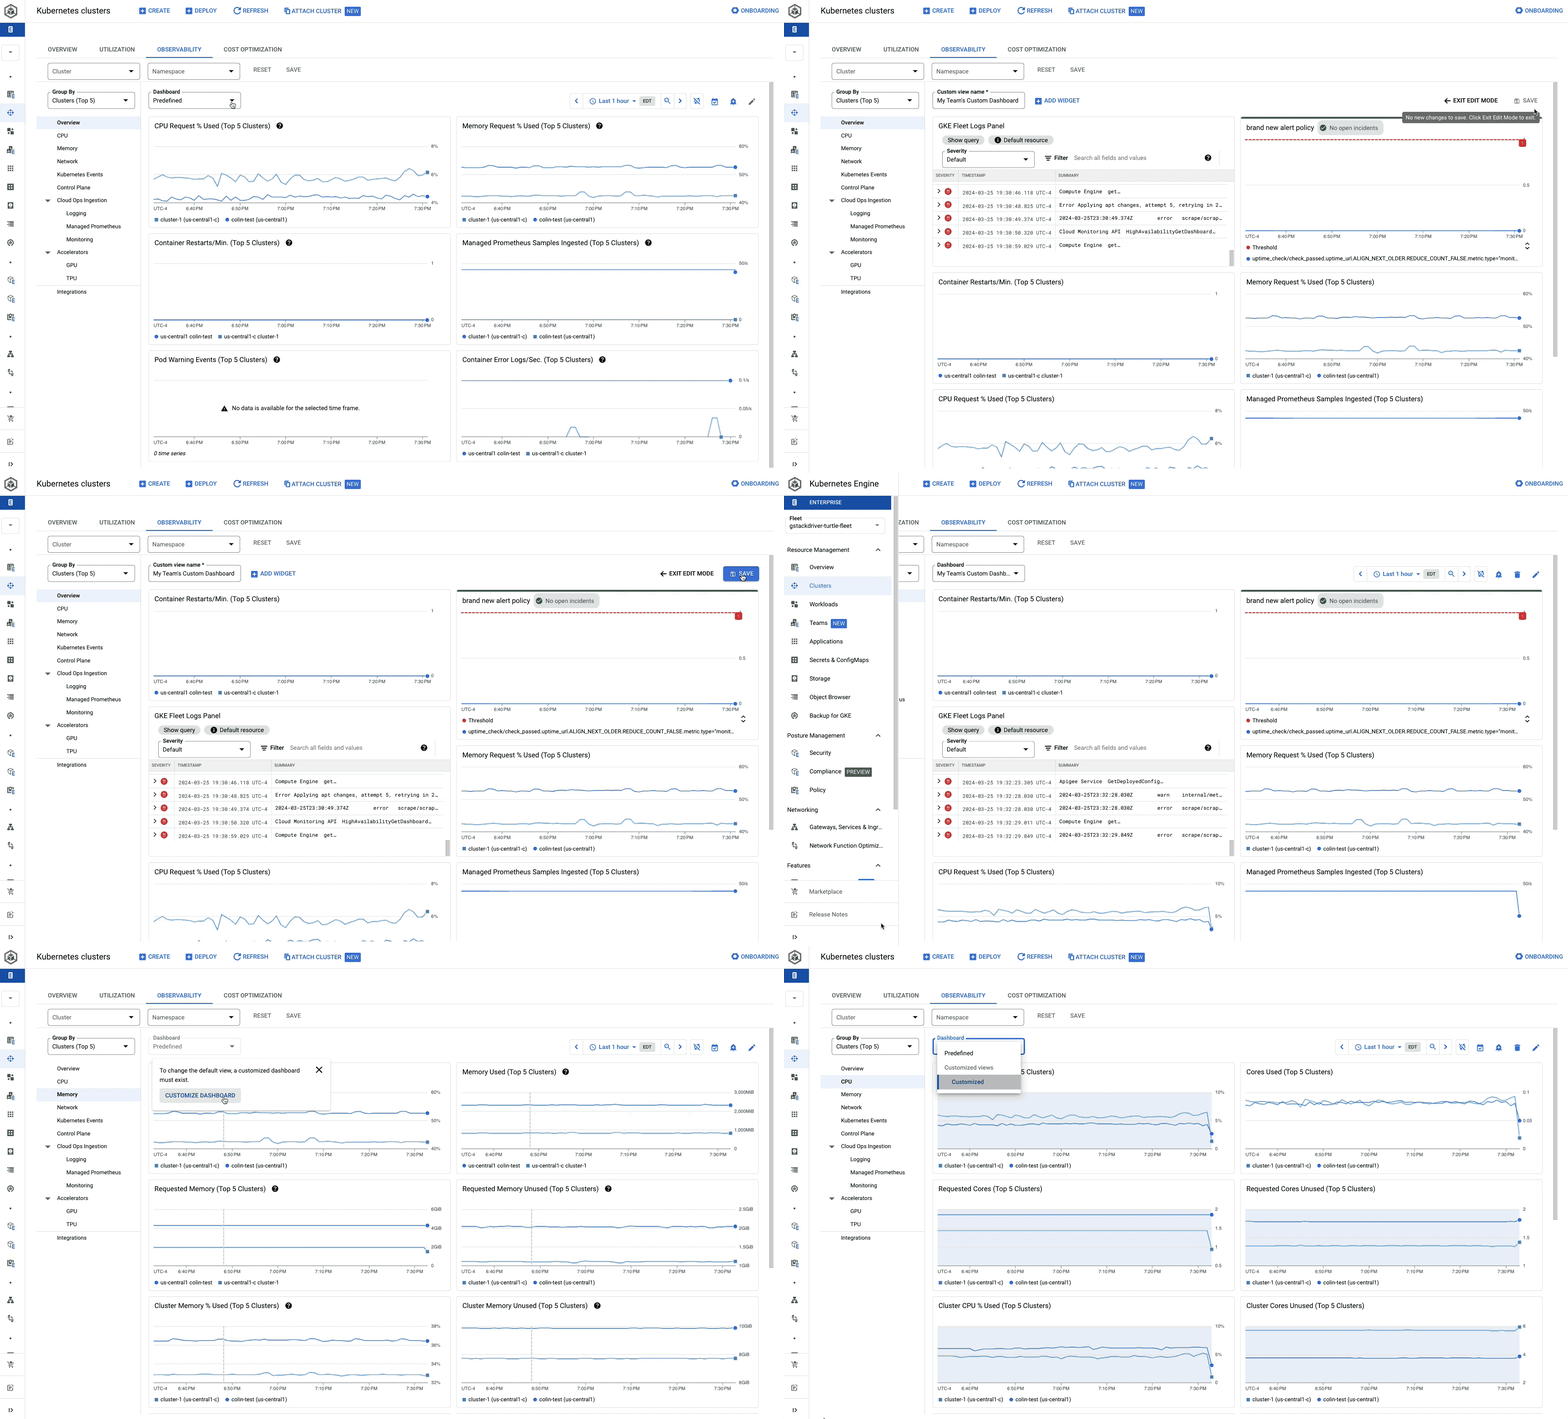
A customizable dashboard on the Kubernetes Cluster Observability tab
What can you do with a customizable dashboard?
The customizable dashboard lets you build in-context observability dashboards for your Google Cloud services and applications. It provides:
Flexibility to define your own insights: Choose the metrics and logs most relevant to your services and applications on specific instances or clusters, to surface the data that truly matters to you.
In-context alert creation: Create alerts directly from the metrics that matter most from the dashboard, or create recommended alerts from the top of the dashboard, and then view alert charts in context.
Cross-service, cross-signal visualization: Unify telemetry from metrics, logs, and alerts into a single, cohesive view. Now, you can combine telemetry from multiple services (e.g., load balancers, compute, and databases) into a single custom dashboard to help you troubleshoot across the stack.
In the example below, click on the ‘customize’ button on the top right to gain access to the full features of a custom dashboard. Then you can configure this GKE Managed Prometheus dashboard to add custom business or application metrics that the predefined dashboard does not include.
Other notable features
Per-instance customization: In some services such as the GKE Cluster Observability page, you can apply cluster-specific customizations, as well as apply customizations to all your clusters.
Explore telemetry in context: Learn what’s going on in your application without leaving or getting redirected to a different tool. Simply click on the magnifying glass icon on each of the charts, which opens the Metrics Explorer for further investigation and customization.
Events annotation: Quickly correlate fluctuations in metrics with potential causes with out-of-the-box, default-on chart annotations of change events, now available in GKE, Compute Engine, and Cloud Run in-context dashboards.
As we release new Cloud Observability and dashboarding features, many will be available automatically for in-context custom dashboards.
Getting started
Go to an observability dashboard for your Google Cloud service (e.g. Compute Engine, GKE, Cloud Run, etc): Look for the customize icon (a pencil) to identify customizable dashboards.
Design your own dashboard: Use the drag-and-drop interface to arrange graphs, charts, and other visualizations that provide the desired level of insight.
Create alert: Easily create alerts that matter to your service or application, add alert charts to your in-context dashboards, or view alerts in cloud monitoring alerting.
The future of Google Cloud observability
While customizing action for a single dashboard is great, it’s also important to be able to apply customizations programmatically to other dashboards and projects in your organization. To that end, we’re working on enabling Terraform support for in-context customization at scale. We’ are also working on allowing more than one custom dashboard for a predefined dashboard.
Our team is dedicated to enhancing the Google Cloud observability experience. The custom in-context dashboard is just the start. We’re committed to providing you with the flexibility and insights necessary to run your applications confidently and efficiently.
Want to learn more or share feedback? We’d love to hear from you! Click on the feedback icon at the top right of the dashboard page and let us know your thoughts!
Haskell Garon and James Wang also contributed to this blog post.
Read More for the details.


