GCP – Are you an Elite DevOps performer? Find out with the Four Keys Project
Through six years of research, the DevOps Research and Assessment (DORA) team has identified four key metrics that indicate the performance of a software development team:
-
Deployment Frequency – How often an organization successfully releases to production
-
Lead Time for Changes – The amount of time it takes a commit to get into production
-
Change Failure Rate – The percentage of deployments causing a failure in production
-
Time to Restore Service – How long it takes an organization to recover from a failure in production
At a high level, Deployment Frequency and Lead Time for Changes measure velocity, while Change Failure Rate and Time to Restore Service measure stability. And by measuring these values, and continuously iterating to improve on them, a team can achieve significantly better business outcomes. DORA, for example, uses these metrics to identify Elite, High, Medium and Low performing teams, and finds that Elite teams are twice as likely to meet or exceed their organizational performance goals.1
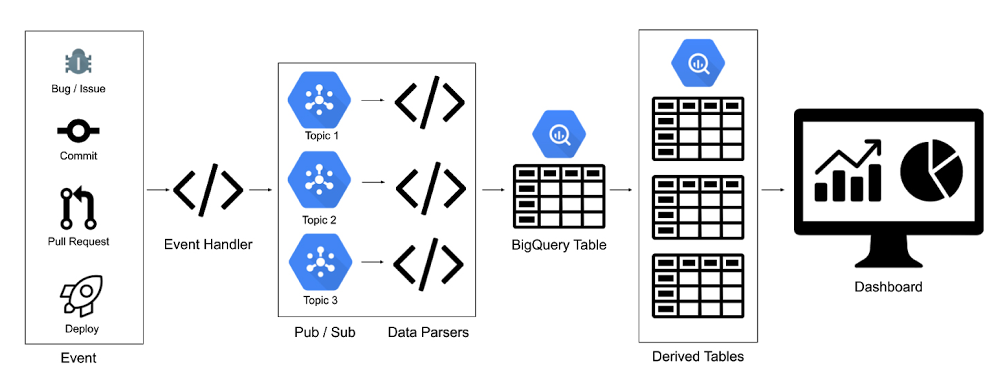
Baselining your organization’s performance on these metrics is a great way to improve the efficiency and effectiveness of your own operations. But how do you get started? The journey starts with gathering data. To help you generate these metrics for your team, we created the Four Keys open source project, which automatically sets up a data ingestion pipeline from your Github or Gitlab repos through Google Cloud services and into Google DataStudio. It then aggregates your data and compiles it into a dashboard with these key metrics, which you can use to track your progress over time.
To use the Four Keys project, we’ve included a setup script in the repo to make it easy to collect data from the default sources and view your DORA metrics. For anyone interested in contributing to the project or customizing it to their own team’s use cases, we’ve outlined the three key components below: the pipeline, the metrics, and the dashboard.
The Four Keys pipeline
The Four Keys pipeline is the ETL pipeline which collects your DevOps data and transforms it into DORA metrics.
One of the challenges of gathering these DORA metrics, however, is that, for any one team (let alone all the teams in an organization), deployment, change, and incident data are usually in different disparate systems. How do we develop an open-source tool that can capture data from these different sources—as well as from sources that you may want to use in the future?
With Four Keys, our solution was to create a generalized pipeline that can be extended to process inputs from a wide variety of sources. Any tool or system that can output an HTTP request can be integrated into the Four Keys pipeline, which receives events via webhooks and ingests them into BigQuery.
In the Four Keys pipeline, known data sources are parsed properly into changes, incidents and deployments. For example, GitHub commits are picked up by the changes script, Cloud Build deployments fall under deployments, and GitHub issues with an ‘incident’ label are categorized as incidents. If a new data source is added and the existing queries do not categorize it properly, the developer can recategorize it by editing the SQL script.
Data extraction and transformation
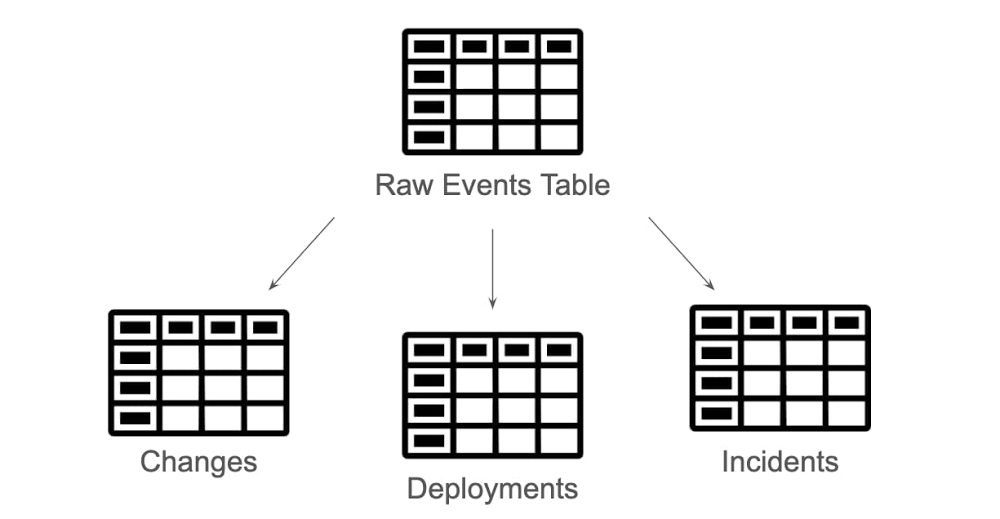
Once the raw data is in the data warehouse, there are two challenges: extraction and transformation. To optimize for business flexibility, both of these processes are handled with SQL. Four Keys uses BigQuery scheduled queries to create the downstream tables from the raw events table.

Four Keys categorizes events into Changes, Deployments, and Incidents using `WHERE` statements, and normalizes and transforms the data with the `SELECT` statement. The precise definition of a change, deployment, or incident depends on a team’s business requirements, making it all the more important to have a flexible way to include or exclude additional events.
While the definition may different from team to team, the scripts do provide defaults to get you started. As an example, here’s the Deployments script:
Four Keys uses the WHERE filter to only pull relevant rows from the events_raw table, and the SELECT statement to map the corresponding fields in the JSON to the commit id. One of the benefits of doing data transformations in BigQuery is that you don’t need to re-run the pipeline to edit or recategorize the data. The JSON_EXTRACT_SCALAR function allows you to parse and manipulate the JSON data in the SQL itself. BigQuery even allows you to write custom javascript functions in SQL!
Calculating the metrics
This section discusses how to translate the DORA metrics to systems-level calculations. The original research done by the DORA team surveyed real people rather than gathering systems data and bucketed metric into a performance level, as follows:
However, it’s a lot easier to ask a person how frequently they deploy than it is to ask a computer! When asked if they deploy daily, weekly, monthly, etc., a DevOps manager usually has a gut feeling which bucket their organization falls into. However, when you demand the same information from a computer, you have to be very explicit about your definitions and make value judgments.
Let’s look at some of the nuances in the metrics definitions and calculations.
Deployment frequency
`How often an organization successfully releases to production.`
Deployment Frequency is the easiest metric to collect, because it only needs one table. However, the bucketing for frequency is also one of the trickier elements to calculate. It would be simple and straightforward to show daily deployment volume or to grab the average number of deployments per week, but the metric is deployment frequency, not volume.
In the Four Keys scripts, Deployment Frequency falls into the Daily bucket when the median number of days per week with at least one successful deployment is equal to or greater than three. To put it more simply, to qualify for “deploy daily,” you must deploy on most working days. Similarly, if you deploy most weeks, it will be weekly, and then monthly and so forth.
Next you have to consider what constitutes a successful deployment to production. Do you include deployments that are only to 5% traffic? 80%? Ultimately, this depends on your team’s individual business requirements. By default, the dashboard includes any successful deployment to any level of traffic, but this threshold can be adjusted by editing the SQL scripts in the project.
Lead Time for Changes
`The amount of time it takes a commit to get into production`
Lead Time to Changes metric requires two important pieces of data: when the commit happened, and when the deployment happened. This means that for every deployment, you need to maintain a list of all the changes included in the deployment. This is easily done by using triggers with a SHA mapping back to the commits. With the list of changes in the deploy table, you can join back to the changes table to get the timestamps, and then calculate the median lead time.
Change Failure Rate
`The percentage of deployments causing a failure in production`
The Change Failure Rate depends on two things: how many deployments were attempted, and how many resulted in failures in production? To get this number, Four Keys needs the total count of deployments—easily acquired from the deployment table—and then links it to incidents. An incident may come from bugs or labels on github incidents, a form to spreadsheet pipeline, an issue management system, etc. The only requirement is that it contain the ID of the deployment so we can join the two tables together.
Time to Restore Services
`How long it takes an organization to recover from a failure in production`
To measure the Time to Restore Services, you need to know when the incident was created and when it was resolved. You also need to know when the incident was created and when a deployment resolved said incident. Similar to the last metric, this data could come from any incident management system.
The dashboard
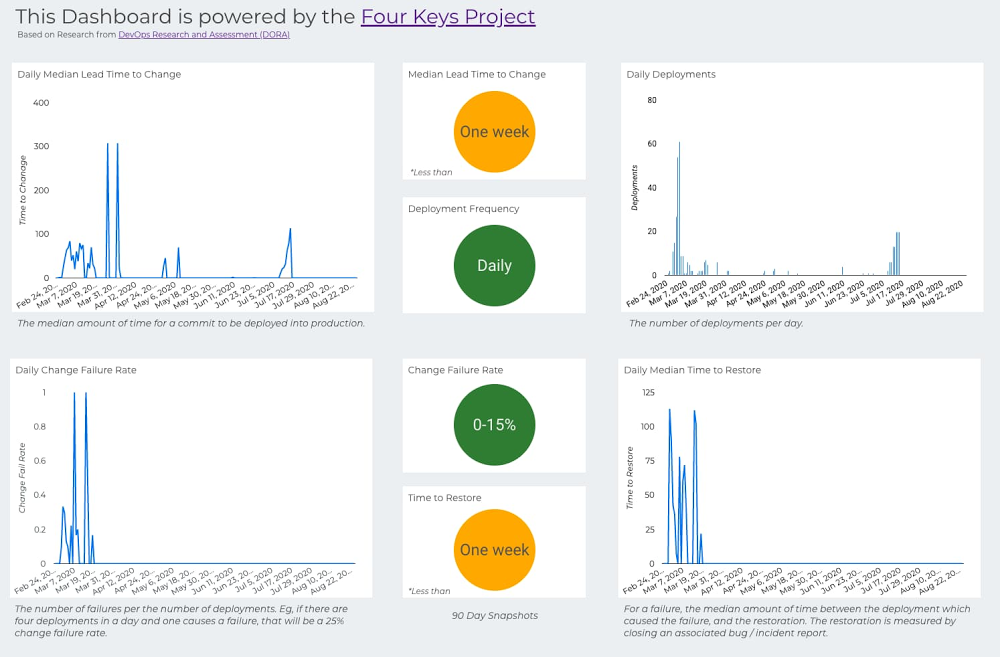
With all the data now aggregated and processed in BigQuery, you can visualize it in the Four Keys dashboard. The Four Keys setup script uses a DataStudio connector, which allows you to connect your data to the Four Keys dashboard template. The dashboard is designed to give you high-level categorizations based on the DORA research for the four key metrics, and also to show you a running log of your recent performance. This allows developer teams to get a sense of a dip in performance early on so they can mitigate it. Alternately, if performance is low, teams will see early signs of progress before the buckets are updated.
Ready to get started?
Please head over to the Four Keys project to try it out. The setup scripts will get you started setting up the architecture and integrating with your projects. We welcome feedback and contributions!
To learn more about how to apply DevOps practices to improve your software delivery performance, visit cloud.google.com/devops. And be on the lookout for a follow-up post on gathering DORA metrics for applications that are hosted entirely in Google Cloud.
1. The 2019 Accelerate State of DevOps: Elite performance, productivity, and scaling
Read More for the details.


