GCP – Increase visibility into Cloud Spanner performance with transaction stats
Cloud Spanner is Google’s fully managed scalable relational database service. We recently announced a new feature, Cloud Spanner transaction statistics, that lets you run SQL queries to retrieve transaction statistics for your database over several time periods. These transaction statistics give you greater visibility into what factors are driving the performance of your transactions.
In this post, you’ll see how to use these transaction statistics to identify which transactions are involved in Cloud Spanner database contentions.
Understanding transactions in Spanner
A transaction in Spanner is used to perform a set of reads and writes that execute atomically at a single logical point in time across columns, rows, and tables in the database. It helps to understand how transactions work in Spanner to best troubleshoot any contentions.
Transaction statistics
Transaction statistics bring you insight into how an application is using the database and are useful when investigating performance issues. For example, you can check whether there are any slow-running transactions that might be causing contention, or you can identify potential sources of high load, such as large volumes of updates to a particular column.
Spanner provides built-in tables that store statistics about transactions. You can retrieve statistics from these SPANNER_SYS.TXN_STATS* tables using SQL statements.
Aggregated transaction statistics
Spanner captures aggregated transaction statistics in the following system tables:
-
SPANNER_SYS.TXN_STATS_TOTAL_MINUTE: Transactions during one-minute intervals -
SPANNER_SYS.TXN_STATS_TOTAL_10MINUTE: Transactions during 10-minute intervals -
SPANNER_SYS.TXN_STATS_TOTAL_HOUR: Transactions during one-hour intervals
Each row in the above tables contains aggregated statistics of all transactions executed over the database during the specific time interval. So, the above tables contain only one row for any given time interval.
Top transaction statistics
Spanner captures transaction statistics including latency, commit attempts, and bytes written in the following system tables.
-
SPANNER_SYS.TXN_STATS_TOP_MINUTE: Transactions during one-minute intervals -
SPANNER_SYS.TXN_STATS_TOP_10MINUTE: Transactions during 10-minute intervals -
SPANNER_SYS.TXN_STATS_TOP_HOUR: Transactions during one-hour intervals
If Spanner is unable to store statistics for all transactions run during the interval in these tables, the system prioritizes transactions with the highest latency, commit attempts, and bytes written during the specified interval.
Find the root cause of a database contention in Spanner
Transaction statistics can be useful in debugging and identifying transactions that are causing contentions in the database. Next, you’ll see how this feature can be used to debug, using an example database where write latencies are high because of database contentions.
Step 1: Identify the time period with high latencies
This can be found in the application that’s using Cloud Spanner. For example, the issue started occurring around “2020-05-17T17:20:00“.
Step 2: See how aggregated transactions metrics changed over a period of time
Query the TXN_STATS_TOTAL_10MINUTE table around the start of the issue. The results of this query may give clues about how latency and other transaction statistics changed over that period of time.
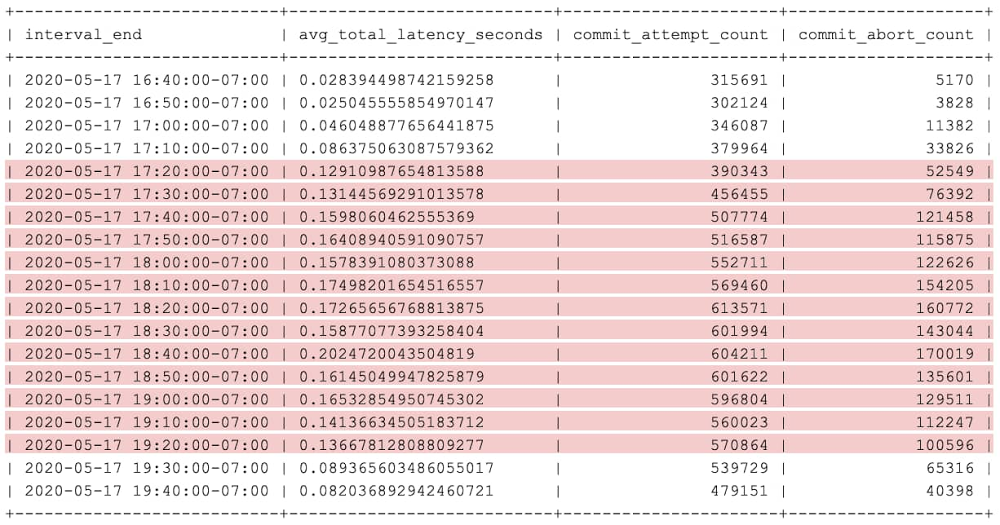
For example, this query can get aggregated transaction statistics, inclusive from “2020-05-17T16:40:00” to “2020-05-17T19:40:00“. This brings back results, one for each 10-minute interval. Here’s what that looks like:
Query
Output
In the results, you can see that aggregated latency and abort count is higher in the highlighted period of time. We can pick any 10-minute interval (for example, interval ending at “2020-05-17T18:40:00“) where aggregated latency and/or abort count are high. Then, in the next step, you can see which transactions are contributing to high latency and abort count.
Step 3: Identify the exact transactions that are causing high latency
Query the TXN_STATS_TOP_10MINUTE table for the interval you picked in the previous step. The results of this query can give some clue about which transactions are having high latency and/or high abort count.
Use the below query to get top performance-impacting transactions in descending order of total latency for the interval ending at “2020-05-17T18:40:00“.
Query
Output
The highlighted row in the preceding table is an example of a transaction experiencing high latency because of a high number of commit aborts.
Step 4: Check for similarities among high-latency transactions
We can fetch read_columns, write_constructive_columns and write_delete_tables columns for transactions with high abort count (also note the fprint value, which will be useful in the next step). This is to check whether high-latency transactions are operating on the same set of columns.
Query
Output
As the output shows, the transactions with the highest average total latency are reading the same columns. We can also observe some write contention, since the transactions are writing to the same column: TestHigherLatency._exists.
Step 5: See the shape of high-latency transactions over the affected period of time
You can see how the statistics associated with this transaction shape have changed over a period of time. Use the following query, where $FPRINT is the fingerprint of the high-latency transaction from the previous step.
Query
Output
In the above output, you can see that total latency is high for the highlighted period of time. And, wherever total latency is high, both commit_attempt_count and commit_abort_count are also high, even though commit latency (commit_latency) has not changed very much. Since transaction commits are getting aborted more frequently, commit attempts are also high because of commit retries.
By using the above troubleshooting steps, we found the transactions that are involved in the contentions. So, high commit abort count is the cause of high latency. The next step is to look at the commit abort error messages received by the application to know the reason for aborts. By inspecting logs in the application, we see the application actually changed its workload during this time. That likely means that some other transaction shape showed up with high attempts_per_second, and that a different transaction (maybe a nightly cleanup job) was responsible for the additional lock conflicts.
Cloud Spanner transaction statistics provides greater observability and insight into your database behaviors. Use both transaction statistics and query statistics to tune and optimize your workloads on Spanner.
To get started with Spanner, create an instance in the Cloud Console or try it out with aSpanner Qwiklab.
Read More for the details.


